
INTRODUCTION
Cardiovascular diseases remain the leading cause of morbidity and mortality worldwide. Prediction of cardiovascular (CV) events is essential for early identification of individuals at risk and implementation of more appropriate preventive interventions. (1,2)
Therefore, it is recommended that all hypertensive patients be assessed to determine their overall cardiovascular risk (CVR) in order to define therapeutic and cardiovascular risk factor control measures. The information from medical history, physical examination, office blood pressure (BP) measurements and the results of recommended complementary studies will determine the presence of associated risk factors, target organ damage, and history of cardiovascular events. With this data it is possible to stratify the overall CVR of hypertensive patients and classify their risk as low, moderate, high and very high. Knowledge of an individual patient’s overall CVR stratification provides important predictive information, a global approach to prevention and the appropriate drug therapy. (3,4)
A series of formulas or risk scores have been proposed to calculate CVR. The calculators arising from them are a heterogeneous group with various limitations (qualitative variables, complementary studies that are not used in daily clinical practice). Many of them have not been validated in our population. (3,4,5)
The Argentine Consensus on Arterial Hypertension proposes an approach similar to that used by the European Society of Hypertension and adapted to our setting. (5)
Although office blood pressure measurement is currently the recommended diagnostic method, it is not free of significant variability and bias due to the inaccuracy of the measurement technique. Thus, several national and international guidelines recommend the use of out-of-office measurements by means of ambulatory blood pressure monitoring (ABPM) to confirm the diagnosis of hypertension (HT) and provide more accurate predictive information. (5,6,7)
In recent years, ABPM has become a useful adjunctive study for the diagnosis and prognostic assessment of CV events in hypertensive patients compared to isolated office measurements. In addition, ABPM can provide additional data, such as blood pressure variability, blood pressure dipping patterns, and mean blood pressure values at different periods of the day. (8-10)
Although the accuracy of cardiovascular risk prediction models has improved over the years, some uncertainty still remains in the estimates. At present, the hemodynamic variables provided by the ABPM are not considered for cardiovascular risk stratification in hypertensive patients. (11,12)
In this regard, it is important to highlight the need for more accurate predictive tools that incorporate the different blood pressure variables derived from ABPM.
One of the most widely used methodological tools for predictive analysis in different areas of medicine, currently in full development, is artificial neural network (ANN). Analysis with ANN as an artificial intelligence (AI) model has shown to be superior in terms of prognostic accuracy (especially in the presence of non-linear associations) to the statistical tools we usually use, such as multivariate analysis and logistic regression. (13,14,15)
ANNs can recognize relevant features in the data and adjust their synaptic weights and connections to improve their predictive performance, which depends on the number of input variables and their training. This allows ANN to make more accurate predictions. (16,17,18)
The application of different machine learning models has been aimed at early detection and screening to identify those who will develop hypertension. (19,20,21,22)
The ANN-based analysis model which integrates ABPM variables could improve the predictive ability and provide information to design a more accurate and complete stratification of CVR compared to the existing models.
This study aimed to evaluate the ability to predict serious events in hypertensive patients at follow-up using an ANN-based analysis model which integrates ABPM variables compared to conventional clinical risk stratification.
METHODS
A database with measurements from ABPM studies was analyzed according to the following inclusion criteria: adult patients (over 18 years of age), with a diagnosis of essential arterial hypertension under drug therapy, who underwent ABPM studies to evaluate treatment efficacy. They were required to have complete follow-up through electronic medical records and clinical visits to a community hospital.
Consecutive ABPM studies performed between September 2013 and April 2020 with complete clinical follow-up until November 2022 were included. Data from the ABPM study reports (the averages of each of the variables were considered) were transferred to a spreadsheet and processed using Visual Basic and SQL softwares.
Cardiovascular risk stratification was performed using the variables proposed by the Argentine Consensus on Arterial Hypertension (Argentine Society of Cardiology, Argentine Society of Arterial Hypertension, Argentine Federation of Cardiology) as a model. (5)
The variables considered were the following: a) Risk factors: age, gender, history of dyslipidemia, diabetes, smoking, obesity; b) Target organ damage: diagnosis of left ventricular hypertrophy (LVH) confirmed by echocardiogram, chronic renal failure (stages 1 and 2); c) Associated clinical conditions or history of cardiovascular events: acute myocardial infarction (AMI), heart failure (HF), stroke and/or transient ischemic attack (stroke/TIA), coronary artery disease, myocardial revascularization, chronic kidney disease (stages 3, 4 and 5).
Low risk was defined as patients with one associated risk factor; moderate risk: patients with two associated risk factors; high risk: patients with three or more associated risk factors and/or diabetes and/or target organ damage; very high risk: patients with history of cardiovascular events or associated clinical conditions. (4,5)
A combined endpoint of serious events (SE) was defined as the occurrence of death and/or non-fatal AMI and/or stroke and/or TIA and/or HF and/or chronic renal failure validated in the electronic medical record by specialists in Internal Medicine and Cardiology according to current national and international guidelines. (3,4,5)
Neural network algorithm models were developed including the ABPM variables as independent cofactors for input to the ANN, and SAE as the dependent event (output layer). An NN algorithm is a special type of non-linear regression that has multiple local minimum values. Therefore, every time the training algorithm runs, it will converge in a different model. To choose the best model, the training process was repeated 50 times. Only models showing the best discriminative power by logistic regression or ANN were selected for comparison.
SPSS 26.0 Statistics was used for statistical analysis and ANN modelling. Different models, architecture and activation functions were compared to select the one with the best performance in terms of discrimination to predict the endpoint.
Categorical variables were expressed as percentages with 95% CI and continuous variables were expressed as means and their respective standard deviation or median and interquartile range (IQR) 25-75, according to their distribution (parametric or non-parametric).
The discriminative ability of ABPM vs. CRS to predict SE was assessed with the area under the receiver operating characteristic curve (AUC-ROC) analysis. For the comparison of the AUC-ROC, the De Long test was used with the MEDCALC program, version 23.0.9.
In order to identify the variables with the greatest weight and usefulness in the development of the ANN, a sensitivity analysis was performed to determine their normalized importance in the model.
Ethical considerations
The study was reviewed and approved by the institutional and independent Ethics Committee. Due to the observational nature of this analysis, informed consent was not required. According to the Declaration of Helsinki of the World Medical Association, (23) every precaution was taken to protect the privacy and confidentiality of all personal information.
RESULTS
We analyzed data from 491 ABPM studies that included 27 numerical variables from each study: means of 24-hour systolic blood pressure (24-h mSBP), 24-hour diastolic blood pressure (24-h mDBP), 24-hour mean blood pressure (24-h mMBP), 24-hour pulse pressure (24-h mPP), 24-hour heart rate (24-h mHR), daytime systolic blood pressure (day mSBP), daytime diastolic blood pressure (day mDBP), daytime mean blood pressure (day mMBP), daytime pulse pressure (day mPP), daytime heart rate (day mHR), nighttime systolic blood pressure (night mSBP), nighttime diastolic blood pressure (night mDBP), nighttime mean blood pressure (night mMBP), nighttime pulse pressure (night mPP), nighttime heart rate (night mHR); variability of 24-hour systolic blood pressure (24-h SBPsd), 24-hour diastolic blood pressure (24-h DBPsd), 24-hour pulse pressure (24-h PPsd), 24-hour mean blood pressure (24-h MBPsd), 24-hour heart rate (24-h HRsd); daytime SBP load (day SBPL), daytime DBP load (day DBPL), nighttime SBP load (night SBPL), nighttime DBP load (night DBPL); daytime blood pressure ≥135/85 mmHg (day HT), nighttime blood pressure ≥120/70 mmHg (night HT), circadian rhythm with nocturnal SBP and/or DBP fall <10% (non-dipping pattern).
Table 1 details the mean values of each variable from the ABPM studies used for ANN modelling for the combined endpoint.
Table 1
Description of the mean values of the ABPM variables.
| ABPM variables | Mean values |
|---|---|
| 24-h mSBP | 126.16 ± 11.65 mmHg |
| 24-h mDBP | 79.22 ± 9.30 mmHg |
| 24-h mMBP | 94.87 ± 9.4 mmHg |
| 24-h mHR | 75.21 ± 8.5 bpm |
| 24-h mPP | 46.93 ± 7.62 mmHg |
| 24-h SBPsd | 17.92 ± 5.6 mmHg |
| 24-h DBPsd | 14.52 ± 4.2 mmHg |
| 24-h PPsd | 16.9 ± 6.1 mmHg |
| 24-h MBPsd | 13.51 ± 3.8 mmHg |
| 24-h HRsd | 11.59 ± 3.1 bpm |
| day mSBP | 130.13 ± 12.2 mmHg |
| day mDBP | 82.35 ± 9.9 mmHg |
| day mMBP | 98.17 ± 10.14 mmHg |
| day mHR | 78.85 ± 9.1 bpm |
| day mPP | 47.77 ± 8.08 mmHg |
| night mSBP | 117.34 ± 13.47 mmHg |
| night mDBP | 72.23 ± 9.90 mmHg |
| night mPP | 48.10 ± 8.99 mmHg |
| night mMBP | 87.27 ± 10.50 mmHg |
| night mHR | 67.47 ± 9.2 bpm |
| day SBPL | 34.86% |
| day DBPL | 42.25% |
| night SBPL | 39.47% |
| night DBPL | 49.68% |
| night HT | 58.4% (95% IC 55-72) |
| day HT | 43.9% (95% IC 40-56) |
| Non-dipping | 42.6% (95% IC 39-55) |
24-h DBPsd: 24-hour diastolic blood pressure variability; 24-h HRsd: 24hour heart rate variability; 24-h mMBP: mean of 24-hour mean blood pressure; 24-h MBPsd: 24-hour mean blood pressure variability; 24-h mDBP: 24-hour mean diastolic blood pressure; 24-h mHR: 24-hour mean heart rate; 24-h mPP: 24-hour mean pulse pressure; 24-h mSBP: 24-hour mean systolic blood pressure; 24-h PPsd: 24-hour pulse pressure variability; 24-h SBPsd: 24-hour systolic blood pressure variability; ABPM: ambulatory blood pressure monitoring; day DBPL: daytime DBP load; day HT: daytime blood pressure ≥135/85 mmHg; day mDBP: daytime mean diastolic blood pressure; day mHR: daytime mean heart rate; day mMBP: mean of daytime mean blood pressure: day mPP: daytime mean pulse pressure; day mSBP: daytime mean systolic blood pressure; day SBPL: daytime SBP load; night DBPL: nighttime DBP load; night HT: nighttime blood pressure ≥120/70 mmHg; night mDBP: nighttime mean diastolic blood pressure; night mHR: nighttime mean heart rate; night mMBP: mean of nighttime mean blood pressure: night mPP: nighttime mean pulse pressure; night mSBP: nighttime mean systolic blood pressure; night SBPL: nighttime SBP load; non-dipping: circadian rhythm with nocturnal SBP and/or DBP fall <10%.
The mean age of the population was 64 ± 14 years, 47% were women, 12% had diabetes, 11% were active smokers, 52% had dyslipidemia and the mean body mass index was 26 ± 4 kg/m2.
The median patient follow-up was 6.6 years (IQR 4.5-8). The endpoint incidence at follow-up was 2.6%. Table 2 details the best ANN models with their neuronal activation functions of the hidden and output layers and their AUC-ROC.
Table 2
Neural network models with best performance (multilayer perceptron with one hidden layer, two hidden layers and with radial basis model) with their neural activation functions of the hidden layer and the output layer, the neural architecture, and their area under the ROC curve.
| Model | Hidden layer activation function | Output layer activation function | Neural architecture | Area under the ROC curve |
|---|---|---|---|---|
| Multilayer perceptron with a hidden layer | Hyperbolic tangent | Softmax | 27/7/2002 | 0.81 (95% CI 0.77-0.90) |
| Multilayer perceptron with two hidden layers | Hyperbolic tangent | Softmax | 27/20/15/2 | 0.75 (95% CI 0.68-0.80) |
| Radial basis | Softmax | Identity | 27/6/2002 | 0.68 (95% CI 0.61-0.70) |
| De Long’s test | Multilayer perceptron 1 hidden layer vs; 2 hidden layers | Multilayer perceptron 1 hidden layer vs; radial basis | Radial basis vs; multilayer perceptron 2 hidden layers | |
| p-value | 0.040 | 0.002 | 0.001 | |
95% CI: 95% confidence interval
The best performing models were the Multilayer Perceptron of a hidden layer (activation function of the hidden layer neurons of hyperbolic tangent type) and those of the output layer of softmax type with a neural architecture (27/7/2) describing the nodes of each of the layers (Figure 1). Table 3 describes the synaptic weights with which the neural network is constructed and trained to predict the endpoint. The hyperbolic tangent function was used as the activation function for the input layer and the softmax for the hidden layer. The sample was split with a segmentation of 70% training group and 30% validation of the algorithms. The estimated synaptic weights were considered for the development and testing of a multilayer perceptron model for the combined endpoint based on the input of the 27 variables from the ABPM studies.
Figure 1
Architecture of the multilayer perceptron type neural network with a hidden layer with 27 neurons in the input layer, 7 neurons in the hidden layer and 2 neurons in the output layer.
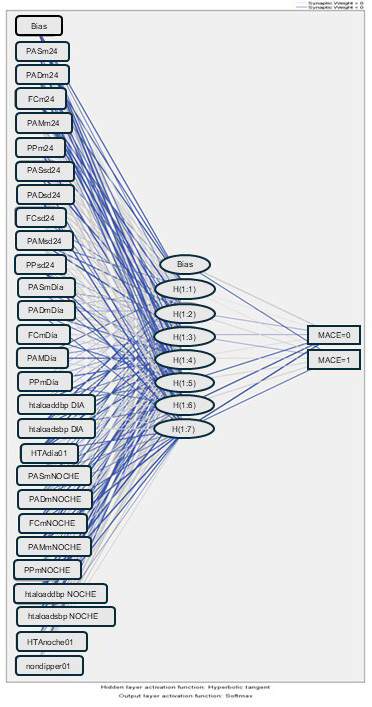
24-h DBPsd: 24-hour diastolic blood pressure variability; 24-h HRsd: 24- hour heart rate variability; 24-h mMBP: mean of 24-hour mean blood pressure; 24-h MBPsd: 24-hour mean blood pressure variability; 24-h mDBP: 24-hour mean diastolic blood pressure; 24-h mHR: 24-hour mean heart rate; 24-h mPP: 24-hour mean pulse pressure; 24-h mSBP: 24-hour mean systolic blood pressure; 24-h PPsd: 24-hour pulse pressure variabil- ity; 24-h SBPsd: 24-hour systolic blood pressure variability; day mDBP: daytime mean diastolic blood pressure; day DBPL: daytime DBP load; day mHR: daytime mean heart rate; day HT: daytime blood pressure ≥135/85; day mMBP: mean of daytime mean blood pressure; day mPP: daytime mean pulse pressure; day mSBP: daytime mean systolic blood pressure; day SBPL: daytime SBP load; night DBPL: nighttime DBP load; night HT: nighttime blood pressure ≥120/70; night mDBP: nighttime mean diastolic blood pressure; night mHR: nighttime mean heart rate; night mMBP: mean of nighttime mean blood pressure; night mPP: nighttime mean pulse pressure; night mSBP: nighttime mean systolic blood pressure; night SBPL: nighttime SBP load; Non-dipping: circadian rhythm with nocturnal SBP and/or DBP <10%; SE: serious event
Table 3
N Description of the synaptic weights with which the neural network is constructed and trained to predict the endpoint.
| Predicted | |||||||||||
|---|---|---|---|---|---|---|---|---|---|---|---|
| Hidden layer 1 | Output layer | ||||||||||
| Predictor+A1:L42 | O (1:1) | O (1:2) | O (1:3) | O (1:4) | O (1:5) | O (1:6) | O (1:7) | PF | [PF = 0] | [PF = 1] | |
| Input layer | (Bias) | 0.526 | 0.579 | -0.457 | -0.125 | -0.394 | -0.600 | 0.459 | |||
| non-dipping 0 | 0.560 | 0.134 | -0.105 | -0.501 | -0.245 | 0.258 | 0.314 | ||||
| non-dipping 1 | 0.293 | -0.190 | 0.180 | -0.293 | -0.418 | -0.298 | -0.112 | ||||
| night HT 0 | -0.018 | -0.055 | 0.410 | -0.073 | 0.170 | -0.531 | 0.356 | ||||
| night HT 1 | 0.046 | 0.100 | -0.270 | 0.251 | -0.128 | -0.358 | 0.424 | ||||
| day HT01 0 | 0.209 | -0.108 | -0.165 | -0.299 | 0.332 | -0.427 | 0.505 | ||||
| day HT01 1 | 0.459 | -0.275 | 0.110 | 0.368 | 0.169 | -0.669 | 0.200 | ||||
| 24-h mSBP | 0.119 | -0.452 | -0.159 | 0.315 | 0.005 | -0.141 | 0.388 | ||||
| 24-h mDBP | 0.334 | -0.166 | 0.080 | -0.167 | 0.241 | 0.417 | -0.365 | ||||
| 24-h mHR | 0.228 | -0.080 | 0.435 | -0.323 | 0.136 | -0.457 | 0.551 | ||||
| 24-h mMBP | 0.486 | 0.475 | 0.216 | 0.019 | 0.036 | -0.313 | 0.321 | ||||
| 24-h mPP | -0.361 | -0.470 | -0.308 | -0.269 | -0.080 | 0.020 | -0.005 | ||||
| 24-h SBPsd | -0.179 | -0.346 | -0.027 | 0.319 | -0.312 | 0.002 | 0.427 | ||||
| 24-h DBPsd | -0.275 | 0.037 | -0.240 | 0.050 | -0.378 | 0.697 | -0.199 | ||||
| 24-h HRsd | -0.184 | 0.178 | -0.381 | 0.133 | 0.228 | -0.230 | -0.109 | ||||
| 24-h MBPsd | -0.208 | 0.170 | -0.290 | 0.268 | -0.269 | 0.153 | -0.023 | ||||
| 24-h PPsd | 0.088 | 0.233 | -0.445 | 0.141 | -0.167 | 0.184 | 0.347 | ||||
| day mSBP | -0.089 | -0.398 | 0.480 | 0.291 | 0.325 | 0.331 | -0.216 | ||||
| day mDBP | -0.330 | 0.307 | -0.107 | 0.391 | 0.243 | -0.350 | 0.110 | ||||
| day mHR | -0.427 | 0.294 | -0.401 | -0.089 | -0.330 | -0.263 | 0.154 | ||||
| day mMBP | -0.470 | 0.010 | 0.345 | 0.318 | -0.147 | -0.041 | -0.604 | ||||
| day mPP | 0.053 | 0.222 | 0.373 | 0.179 | 0.133 | -0.169 | -0.001 | ||||
| day SBP load | 0.476 | 0.488 | -0.056 | -0.249 | 0.460 | -0.051 | 0.265 | ||||
| day DBP load | 0.265 | 0.474 | 0.331 | -0.092 | 0.126 | 0.365 | 0.372 | ||||
| night mSBP | -0.266 | -0.077 | -0.196 | -0.281 | -0.514 | 0.146 | -0.317 | ||||
| night mDBP | 0.134 | 0.278 | -0.099 | 0.426 | -0.488 | 0.554 | 0.269 | ||||
| night mHR | -0.429 | -0.124 | -0.280 | -0.184 | 0.066 | 0.307 | -0.257 | ||||
| night mMBP | -0.260 | 0.253 | 0.435 | 0.511 | -0.116 | -0.308 | -0.046 | ||||
| night mPP | 0.313 | -0.343 | -0.294 | 0.278 | -0.272 | -0.245 | -0.196 | ||||
| night SBP load | -0.376 | -0.294 | 0.233 | -0.010 | -0.285 | -0.195 | -0.305 | ||||
| night DBP load | 0.189 | -0.134 | -0.062 | -0.336 | 0.122 | -0.123 | 0.276 | ||||
| Hidden layer 1 | (Bias) | -1.302 | 1.206 | -0.093 | |||||||
| O (1:1) | -0.348 | 0.844 | 0.712 | ||||||||
| O (1:2) | -0.230 | 0.008 | 0.005 | ||||||||
| O (1:3) | 0.121 | -0.058 | -0.129 | ||||||||
| O (1:4) | 0.158 | -0.023 | -0.129 | ||||||||
| O (1:5) | -0.031 | 0.045 | -0.504 | ||||||||
| O (1:6) | 0.589 | -0.891 | -0.178 | ||||||||
| O (1:7) | -0.553 | 0.691 | -0.168 | ||||||||
24-h DBPsd: 24-hour diastolic blood pressure variability; 24-h HRsd: 24-hour heart rate variability; 24-h mMBP: mean of 24-hour mean blood pressure; 24-h MBPsd: 24-hour mean blood pressure variability; 24-h mDBP: 24-hour mean diastolic blood pressure; 24-h mHR: 24-hour mean heart rate; 24-h mPP: 24-hour mean pulse pressure; 24-h mSBP: 24-hour mean systolic blood pressure; 24-h PPsd: 24-hour pulse pressure variability; 24-h SBPsd: 24-hour systolic blood pressure variability; day DBPL: daytime DBP load; day HT: daytime blood pressure ≥135/85 mmHg; day mMBP: mean of daytime mean blood pressure; day mDBP: daytime mean diastolic blood pressure; day mHR: daytime mean heart rate; day mPP: daytime mean pulse pressure; day mSBP: daytime mean systolic blood pressure; day SBPL: daytime SBP load; night DBPL: nighttime DBP load; night HT: nighttime blood pressure ≥120/70 mmHg; night mMBP: mean of nighttime mean blood pressure; night mDBP: nighttime mean diastolic blood pressure; night mHR: nighttime mean heart rate; night mPP: nighttime mean pulse pressure; night mSBP: nighttime mean systolic blood pressure; night SBPL: nighttime SBP load; non-dipping: circadian rhythm with nocturnal SBP and/or DBP fall <10%.
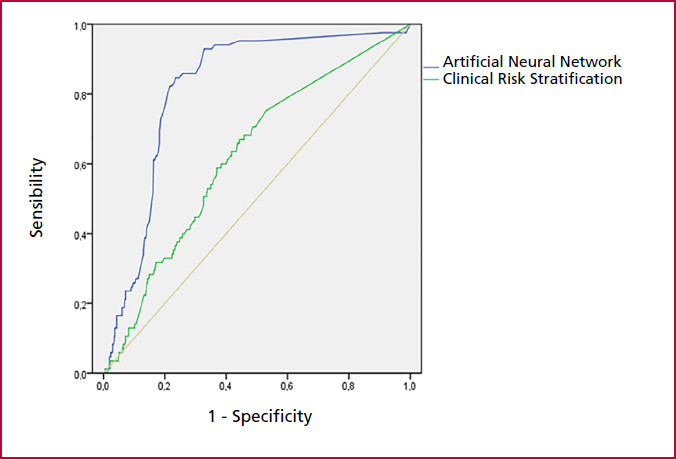
The AUC-ROC of the analysis of ABPM variables using neural networks was 0.81 (95% CI 0.77-0.90) compared to clinical risk stratification, 0.67 (95% CI 0.56-0.77), for the combined endpoint; De Long's test p < 0.001 (Figure 2).
Figure 2;
Comparison of the areas under the ROC curve; ABPM variables analyzed with artificial neural networks: 0.81 (95% CI 0.77-0.90) versus clinical risk stratification: 0.67 (95% CI 0.56-0.77); De Long's test p < 0;001
The variables with the greatest weight and usefulness in the development of the neural network or normalized importances in this model were: nighttime mean systolic blood pressure (night mSBP) with a value of 100%, followed by 24-hour mean systolic blood pressure (24-h mSBP), BMI, mean of 24-hour mean blood pressure (24-h mMBP), nighttime mean blood pressure (night mMBP) and 24-hour mean pulse pressure (24-h mPP) (Figure 3).
Figure 3
Bar graph representing the variables with the highest normalized importance for the development of the artificial neural network in this model
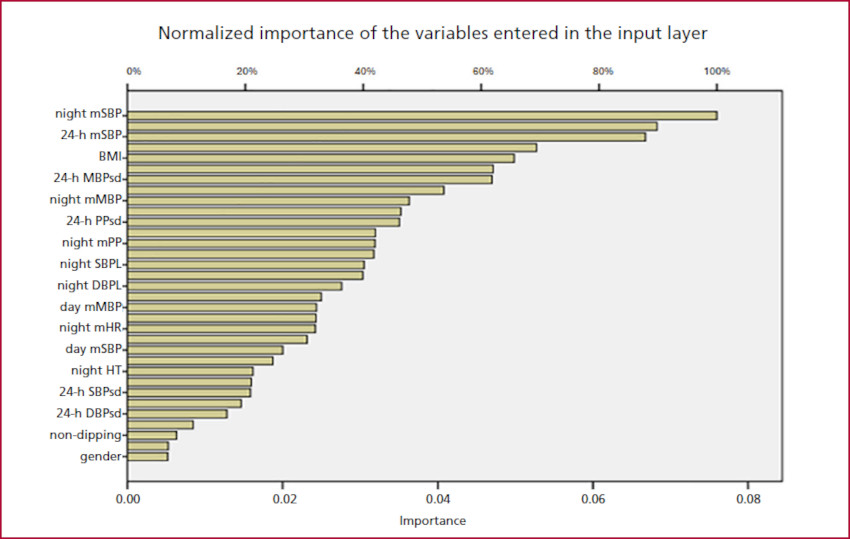
24-h DBPsd: 24-hour diastolic blood pressure variability; 24-h MBPsd: 24-hour mean blood pressure variability; 24-h mSBP: 24-hour mean systolic blood pressure; 24-h PPsd: 24-hour pulse pressure variability; 24-h SBPsd: 24-hour systolic blood pressure variability; BMI: body mass index; day mMBP: mean of daytime mean blood pressure; day mSBP: daytime mean systolic blood pressure; night DBPL: nighttime DBP load; night HT: nighttime blood pressure ≥120/70 mmHg; night mMBP: mean of nighttime mean blood pressure; night mHR: nighttime mean heart rate; night mPP: nighttime mean pulse pressure; night mSBP: nighttime mean systolic blood pressure; night SBPL: nighttime SBP load; Non-dipping: circadian rhythm with nocturnal SBP and/or DBP <10%.
DISCUSSION
To our knowledge, this analysis is the first to report the predictive ability of the analysis of variables from ABPM studies using ANN and their superiority compared to clinical risk stratification for long-term events in hypertensive patients.
The importance of stratifying hypertensive patients according to their estimated risk of a cardiovascular events allows treatment to be adapted to this risk rather than to the office BP levels alone. Among the most widely used risk scales are the Framingham equation, the SCORE (Systematic Coronary Risk Evaluation) system, the QRISK, calculators from different United States medical societies and from the World Health Organization, the latter adapted to different geographical areas. In our country, the stratification recommended by the Argentine Consensus on Arterial Hypertension is applied. (3,4,5)
However, the scores have several limitations that may affect their accuracy and applicability, such as differences between populations according to geographic regions, environmental and socioeconomic characteristics, underestimation of the risk in young patients, qualitative difference in risk factors in many cases, and failure to identify patients with a diagnosis of masked hypertension. Most scores do not consider antihypertensive treatment to reduce o predict risk in the short term. (15,16)
In contrast to the conventional multivariate analysis methods, the trained ANN algorithm is presented as a powerful tool to predict events, as it includes all the variables available in the ABPM studies which avoids bias in the selection of variables.
Multi-layer Perceptron neural networks are among the most powerful and popular network architectures. They consist of an input layer, an arbitrary number of hidden layers, and an output layer. Each of the hidden or output neurons receives an input from neurons in the previous layer (backward connections), but there are no lateral connections between neurons within each layer. The input layer contains as many neurons as categories corresponding to the independent variables (categorical and continuous). The output layer corresponds to the response variable, which in this case is a categorical variable (combined endpoint).
Radial basis neural networks are those whose activation functions at the hidden nodes are radially symmetric. A function is said to be radially symmetric if its output depends on the distance between a vector that stores the input data and a vector of synaptic weights, which is called the center or centroid. (17,18,19,20)
Previous studies using machine learning have studied its usefulness as a method to screen and early detect hypertension in different populations around the world, while other research groups have used it to predict events in hypertensive patients. (21,22,24,25,26)
Other authors have reported the usefulness of learning machines to optimize decision making in order to improve the treatment of hypertensive patients based on clinical data, and to achieve high accuracy when predicting the individual probability of achieving office blood pressure targets with different treatments. The AUC-ROC were very close to 0.90, indicating high prediction accuracy, and the Kappa coefficients were close to 0.8, showing high levels of agreement between observed and predicted target outcomes. (27,28)
The AUC-ROC shows that the ANNs detect nonlinear relationships between independent and dependent variables beyond the scope of logistic regression. These results support the usefulness of the ANN as a method of analysis in the prediction of serious events in hypertensive patients. (24,27)
ANN-based prediction models prove to be robust and reliable and could be implemented in clinical practice as decision support tools. This method would early identify those hypertensive patients at higher risk of developing serious events and would allow more effective preventive interventions. (22,24,25,26)
We highlight that nighttime mean systolic blood pressure (night mSBP) presented an independent normalized significance for the determination of the model. Nocturnal blood pressure has been shown to be an independent risk variable in the prediction of cardiovascular events in hypertensive patients, associated with a higher incidence of stroke, myocardial infarction, heart failure and renal failure. (29)
During nighttime hours, blood pressure follows a characteristic circadian pattern, with a physiological decrease. In hypertensive patients, this decrease may be insufficient or even reversed, known as non-dipping or reverse dipping pattern. These abnormal nocturnal blood pressure patterns have been associated with increased cardiovascular risk and events. (29,30,31)
Different publications have described that increased nighttime mSBP is associated with higher risk of cardiovascular events in hypertensive patients, even after adjusting for other known risk factors. (30,31,32,33,34,35,36,37,38)
Considering previous observations and the results of this study using the ANN analysis, nighttime mSBP could be considered a useful marker for cardiovascular risk stratification in hypertensive patients. Its evaluation would help to identify patients at higher risk of complications and would allow their reduction by clinical interventions.
The effective implementation of the current neural network models can be done using software or hardware systems. Thus, the synaptic weights of the proposed architectures can be trained and calculated through a Python algorithm. In turn, this algorithm should be able to automatically read data sets from electronic study records.
The present study shows that the analysis of ABPM variables using ANNs has a significant predictive value of serious events in hypertensive patients. This suggests the importance of considering ABPM variables for risk stratification in hypertensive patients and shows that the ANNs are an effective tool for the predictive analysis of cardiovascular events with adequate accuracy.
Limitations
Although several clinical and ABPM variables were used, the inclusion of other measurements, such as microalbuminuria or peripheral vascular disease, may provide additional information to improve the predictive capacity. Risk stratification was performed using all data available in the electronic medical record.
In our opinion, the retrospective nature of the analysis is a limitation due to the associated biases that affect the quality of the evidence. The single-center nature of this study limits the transfer of our results to the real world.
A larger sample size with a prospective analysis, external validations in different cohorts of hypertensive patients and the participation of various healthcare centers would optimize the robustness of this study hypothesis.
Neural network algorithms have been criticized on several occasions for being "black boxes" with limited ability to identify possible causal relationships. In the present study we identify the most influential factors in the algorithm modelling using standardized importance values.
The performance quality of learning machines and their algorithms is associated with a larger proportion of events and a higher volume of cases in the total population compared to this study. It should be noted that the incidence of events registered in our work is consistent with that reported in the literature for the outpatient hypertensive population. (39,40,41)
CONCLUSION
The novelty of this study is that it was the first to publish the use of ANNs integrating the ABPM variables to predict long-term events compared to currently recommended cardiovascular risk stratification.
Of additional interest, we observed that nighttime mean SBP was the variable with the greatest weight in the performance of the ANN.
In our view, this analysis is a generator of a research hypothesis to be evaluated in future multicenter studies using adequate power and real-world representativeness to transfer its results.
These algorithms can be integrated into the results of each ABPM study to automatically calculate the probability of risk of serious events in hypertensive patients at follow-up, thus supporting physician’s decision making.
Conflicts of Interest
None declared. (See the author's conflict of interests forms on the Web).
Acknowledgments
The authors would like to thank Engineer Roberto Bunge (Director of Artificial Intelligence Engineering, Universidad San Andrés) and Engineer Trinidad Monreal (Research and Development, Artificial Intelligence and Robotics Laboratory, Universidad San Andrés) for their contributions and expertise in artificial intelligence and neural networks.
Financing
The authors declare they have not received any funding for this work.
Policy on the use of artificial intelligence
Artificial intelligence resources have not been used to write the text or to create the tables or graphs.