
INTRODUCTION
Chronic infection with Trypanosoma cruzi, the etiological agent of Chagas disease, remains a critical public health challenge in Latin America. Current estimates suggest that over 7 million people are infected across 21 countries, with an annual incidence of approximately 30 000 new cases, 9000 of which result from vertical transmission. The disease accounts for roughly 12 000 deaths annually and has evolved into a global health threat due to increased migratory patterns. (1-4)
Although the chronic phase can remain asymptomatic for decades, up to 30% of patients eventually develop progressive cardiac complications, including complex arrhythmias, heart failure, dilated cardiomyopathy, and sudden cardiac death. (5-8)
Despite its significant clinical and socioeconomic burden, the prognosis for Chagas disease remains difficult to determine. Existing tools are limited and often lack adaptability to diverse clinical contexts. The Rassi score, developed in Brazil, is the most widely utilized model; however, its applicability outside Brazil is constrained by significant phenotypic and epidemiological variations across endemic regions. (9)
In Argentina, where Chagas remains a leading cause of cardiomyopathy and premature cardiovascular mortality in young adults, a locally calibrated risk model has yet to be established.
OBJECTIVE
The study aimed to identify long-term mortality predictors in a cohort of patients with chronic Trypanosoma cruzi infection at a public hospital in Buenos Aires and to develop a specific prognostic score for this population.
METHODS
This was a retrospective, single-center study. It consecutively included patients ≥18 years of age with confirmed positive serology for Chagas disease who attended the Cardiology Division Chagas Program at a public hospital in Buenos Aires. Each participant underwent a comprehensive evaluation, including clinical history, electrocardiogram (ECG), Doppler echocardiography, and 24-hour Holter monitoring.
Follow-up was performed by reviewing the unified electronic medical records of the Government of the City of Buenos Aires and through telephone contact with patients or their relatives. The primary endpoint was all-cause mortality.
Statistical analysis
Clinical and electrocardiographic variables, as well as echocardiographic left ventricular ejection fraction, were evaluated
To develop the score, patients were randomly divided into two groups a "Derivation" group, from which predictors were identified and selected to build the score, comprising 70% of the subjects, and a "Validation" group that assessed score performance.
Numerical variables are expressed as mean and standard deviation, using Student's t-test to compare between groups. Categorical variables are expressed as number of cases and the corresponding percentage, using the chi-square test to compare between groups. Time to all-cause death was identified as outcome.
The different variables were evaluated in the derivation group, initially using the univariate Cox regression model, with time to all-cause as outcome and each of the clinical variables, ECG, Holter monitoring and echocardiogram as predictors. All predictors with p < 0. 0.05 were then used for the joint evaluation of their effect using a multivariate Cox regression model with backward selection strategy in the stepwise regression method. Subsequently, the predictors that in this analysis had an associated p < 0.05 were selected to build the score. To optimize score assignment numerical predictors were categorized into discrete groups.
Each independent predictor was assigned a weight proportional to its estimated hazard ratio. The score developed was then stratified into risk categories by estimating survival within the validation group using the Kaplan-Meier method. Finally, the model's predictive performance was assessed through the Area Under the ROC Curve (AUC) for 5- and 8-year mortality
The analyses were performed using the survival (3.83 version), survminer (0.5.0 version), and survival ROC (1.0.3.1 version) packages of the R software (4.5.0 version, R Development Core Team/R Foundation for Statistical Computing, Vienna, Austria).
Ethical considerations
The study was conducted in accordance with the principles of the Declaration of Helsinki (10) and approved by the institutional Teaching and Research Committee.
RESULTS
Among a total of 603 patients enrolled, 422 were assigned to the derivation group and 181 to the validation group. Mean age was 58 ± 12 years, 63% were female, and mean left ventricular ejection fraction (LVEF) was 56%. Baseline characteristics were comparable across both groups, except for a slightly older age in the validation group (Table 1).
Table 1
Baseline population characteristics
| GROUPS | |||
|---|---|---|---|
| Derivation (n=422) | Validation (n=181) | p | |
| Female | 274 (64.9) | 114 (62.9) | 0.716 |
| Age | 59.04 ± 12.30 | 56.52 ± 12.71 | 0.023 |
| NYHA FC | 0.954 | ||
| 1 | 367 (87.0) | 156 (86.2) | |
| 2 | 44 (10.4) | 21 (11.6) | |
| 3 | 9 (2.1) | 3 (1.7) | |
| 4 | 2 (0.5) | 1 (0.6) | |
| Hypertension | 133 (31.5) | 49 (27.1) | 0.321 |
| Diabetes | 49 (11.6) | 16 (8.8) | 0.388 |
| Smoking | 15 (3.6) | 2 (1.1) | 0.162 |
| Dyslipidemia | 37 (8.8) | 16 (8.8) | 1 |
| Coronary heart disease | 0 (0.0) | 0 (0.2) | 1 |
| LVEF | 56.06 ± 13.26 | 56.94 ± 12.87 | 0.455 |
| AF | 48 (11.4) | 13(7.2) | 0.156 |
| LBBB | 32 (7.6) | 7 (3.9) | 0.129 |
| RBBB | 59 (14.0) | 29 (16.0) | 0.656 |
| LAFB | 70 (16.6) | 35 (19.3) | 0.485 |
| LPFB | 4 (0.9) | 1 (0.6) | 0.999 |
| AVB 1G | 10 (2.4) | 6 (3.3) | 0.734 |
| AVB 2G Mobitz I | 1 (0.2) | 0 (0.0) | 1 |
| AVB 2G Mobitz II | 1 (0.2) | 0 (0.0) | 1 |
| AVB 3G | 2 (0.5) | 3 (1.7) | 0.328 |
| ICD | 27 (6.4) | 8 (4.4) | 0.446 |
Quantitative variables are presented as mean ± standard deviation, and qualitative variables as n (%)
AF: atrial fibrillation; AVB: atrioventricular block; G: grade; ICD: implantable cardioverter-defibrillator; LAFB: left anterior fascicular block; LBBB: left bundle branch block; LPFB: left posterior fascicular block; LVEF: left ventricular ejection fraction; NYHA FC: New York Heart Association functional class; RBBB: right bundle branch block.
Over a median follow-up of 6.6 years, 63 deaths occurred in the derivation group and 20 deaths in the validation group.
In the derivation group univariate Cox regression analysis, 9 predictors among all the variables analyzed were significantly associated with mortality rate. functional class, history of implantable cardioverter-defibrillator (ICD), presence of atrial fibrillation, left bundle branch block, right bundle branch block, ventricular arrhythmias and age were related with increased mortality, while LVEF was inversely proportional to mortality (Table 2).
Table 2
Univariate Cox regression analysis u
| Predictor | HR | 95% CI | p |
|---|---|---|---|
| LVEF | 0.93 | 0.91-0.94 | <0.001 |
| Age | 1.08 | 1.05-1.11 | <0.001 |
| NYHA FC | 2.19 | 1.61-2.96 | <0.001 |
| ICD | 7.78 | 4.40-13.80 | <0.001 |
| AF | 3.77 | 2.17-6.52 | <0.001 |
| LBBB | 5.55 | 3.09-9.96 | <0.001 |
| RBBB | 2.01 | 1.13-3.59 | 0.018 |
| Coronary heart disease | 6.27 | 0.87-45.36 | 0.069 |
| Ventricular arrhythmia | 3.14 | 1.80-5.47 | 0.001 |
| Supraventricular arrhythmia | 0.37 | 0.13-1.01 | 0.052 |
| Hypertension | 1.22 | 0.73-2.04 | 0.441 |
| Diabetes | 1.73 | 0.90-3.31 | 0.099 |
| Smoking | 2.03 | 0.63-6.50 | 0.232 |
| Dyslipidemia | 1.22 | 0.52-2.80 | 0.664 |
| Female gender | 0.34 | 0.20-0.56 | <0.001 |
| LAFB | 1.74 | 0.96-3.01 | 0.066 |
| LPFB | 1.42 | 0.20-10.28 | 0.726 |
| AVB 1 G | 2.21 | 0.69-7.03 | 0.183 |
AF: atrial fibrillation; AVB: atrioventricular block; CI : confidence interval; G: grade; HR: hazard ratio; ICD: implantable cardioverter-defibrillator; LAFB: left anterior fascicular block; LBBB: left bundle branch block; LPFB: left posterior fascicular block; LVEF: left ventricular ejection fraction; NYHA FC: New York Heart Association functional class; RBBB: right bundle branch block.
These variables were included in a multivariate Cox regression model, in which three remained as independent predictors of mortality: age (HR 1.07; 95% CI 1.05--1.09; p<0.001), LVEF (HR 0.94; 95% CI 0.92--0.96; p<0.001) and history of ICD (HR 7.8; 95% CI 1.01--60.2; p=0.049). (Table 3)
Table 3
Multivariate Cox regression analysis
| Variable | HR | 95% CI | p |
|---|---|---|---|
| LVEF | 0.94 | 0.92--0.96 | <0.001 |
| Age | 1.07 | 1.05--1.09 | <0.001 |
| NYHA FC | 2.19 | 1.61-2.96 | <0.001 |
| 1.02 | 0.64--1.64 | 0.923 | <0.001 |
| ICD | 7.86 | 1.01--60.2 | 0.049 |
| AF | 1.31 | 0.72--2.38 | 0.372 |
| LBBB | 0.90 | 0.43-1.90 | 0.787 |
| RBBB | 1.72 | 0.92-3.24 | 0.090 |
| Ventricular arrhythmia | 0.20 | 0.03-1.52 | 0.120 |
AF: atrial fibrillation; CI: confidence interval; HR: hazard ratio ICD: implantable cardioverter-defibrillator; LBBB: left bundle branch block; LVEF: left ventricular ejection fraction; NYHA FC: New York Heart Association functional class; RBBB: right bundle branch block.
Next, the relationship between the continuous predictors LVEF and age was explored in order to divide them into categories that would simplify the construction of the score without affecting its predictive accuracy.
Figure 1 shows the survival function in relation to LVEF (A), which appeared to be nonlinear, and age (B), which appeared to be adequately linear. Therefore, the most appropriate partitioning of the LVEF and age scales was designed.
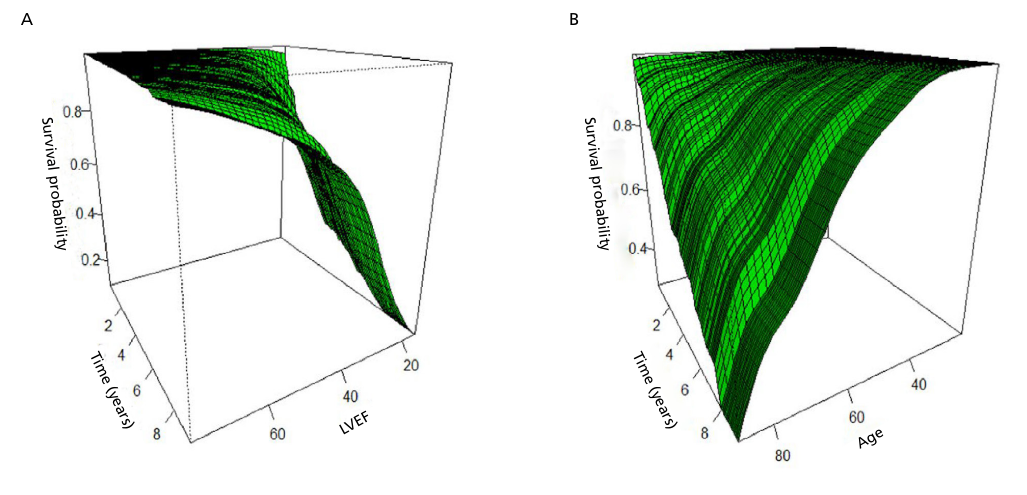
Age was divided into five categories: I) age < 40 years, II) age ≥ 40 years and < 50 years, III) age ≥ 50 years and < 60 years, IV) age ≥ 60 years and < 70 years, and V) age >70 years. It was analyzed as an ordinal scale, that is, the coefficient expresses the effect of changing from one category to the next.
LVEF was divided into four categories based on clinical evidence regarding its behavior in relation to prognosis and response to different treatments: I) LVEF ≥ 53%, II) LVEF < 53% and ≥ 40%, III) LVEF < 40% and ≥ 30%, and IV) LVEF < 30%. It was analyzed as a multinomial scale, that is, the coefficient expresses the effect of each category I in relation to category I (baseline).
Table 4 shows Cox regression results with age and LVEF rescaled variables. Subsequently, the score variables are shown with their corresponding values (Table 5).
Table 4
Cox regression results with age and LVEF rescaled variables
| Variable | HR | 95% CI | p |
|---|---|---|---|
| Age (every 10 years from age 40 onwards) | 2.28 | 1.70-3.06 | <0.001 |
| LVEF < 53-40 | 3.06 | 1.41-6.67 | 0.005 |
| LVEF < 40-30 | 6.41 | 3.19-12.88 | <0.001 |
| LVEF < 30 | 11.41 | 5.20-25.01 | <0.001 |
| ICD | 1.84 | 0.89-3.80 | 0.099 |
CI: confidence interval; HR: hazard ratio; ICD: implantable cardioverter defibrillator; LVEF: left ventricular ejection fraction.
Table 5
Argen- CHAG variables with their corresponding scores
| Variable | Category | Score |
|---|---|---|
| ICD | Present | 2 |
| Absent | 0 | |
| Age (years) | < 40 | 0 |
| 40--49 | 2 | |
| 50--59 | 4 | |
| 60--69 | 6 | |
| ≥ 70 | 8 | |
| LVEF % | ≥ 53 | 0 |
| 40--52 | 3 | |
| 30--39 | 6 | |
| <30 | 12 |
ICD: implantable cardioverter defibrillator; LVEF: left ventricular ejection fraction;
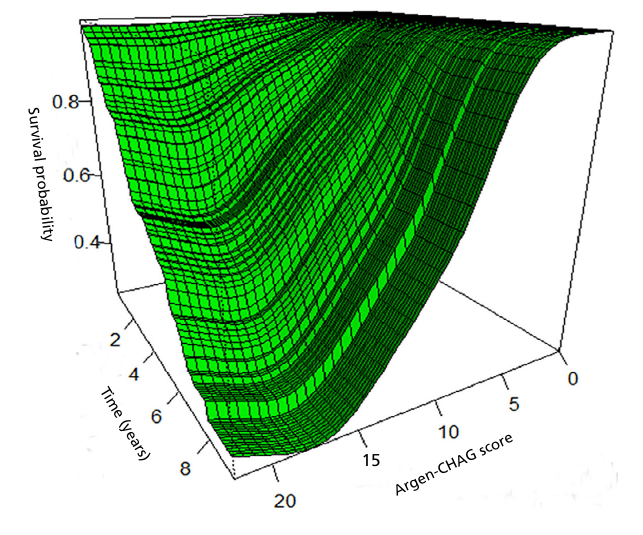
Figure 2 shows modeling of the relationship between survival function, time, and score values, where there is a marked difference in survival between the lowest values, with virtually zero mortality, and the highest values, with very high mortality.
The risk score for each patient was then calculated according to the values of each predictor, and the final score was divided into three categories: 1) low risk: score 0 to 4, 2) moderate risk: score 5 to 12, and 3) high risk: score ≥ 13 points. The survival function was calculated in the derivation group to evaluate its discriminatory capacity between risk groups, and in the validation group to evaluate the performance of the score in another similar group.
Figure 3 shows the Kaplan-Meier survival curves for each of the three risk categories defined by the score, both for the derivation group (Figure 3A) and for the validation group (Figure 3B), where the wide difference in survival between the categories and the similar behavior in both groups suggest adequate risk discrimination and reproducibility. In the validation group, consistent with the derivation group, mortality was 87.5% at 6.3 years in the high-risk group, 33% at 8.75 years in the moderate-risk group and only 8% at 8.7 years in the low-risk group (Figure 4)
Fig. 3.
Kaplan -Meier curves for each of the three score categories in both groups. A, Survival in the derivation group. B Survival in the validation group.
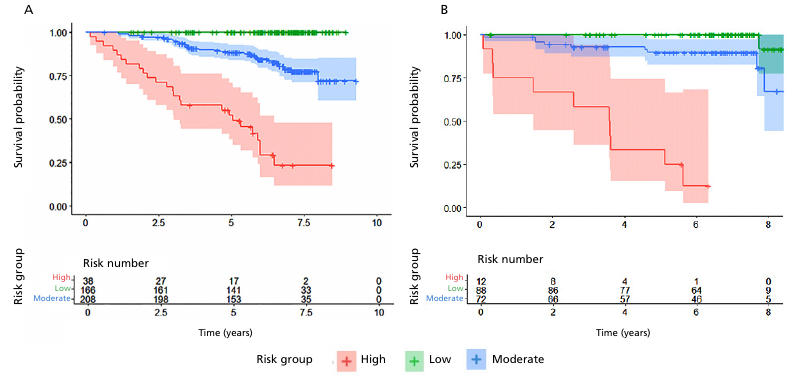
Fig. 4.
Stratification of mortality risk according to the ARGEN-CHAG score, showing low, moderate and high-risk categories, together with mortality during follow-up.
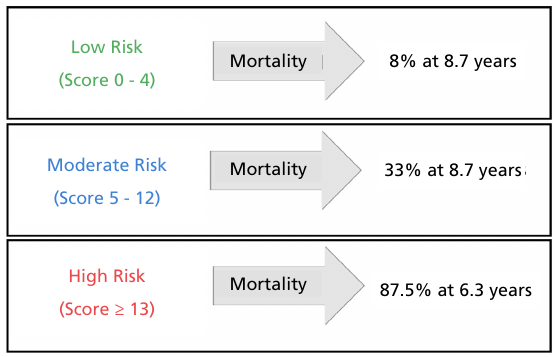
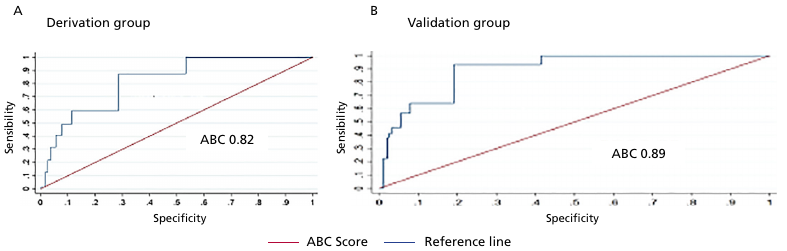
Figure 5 shows the performance of the model evaluated using the area under the ROC curve (AUC) for all-cause mortality at 5 years. The AUC was 0.82 in the derivation group (Figure 5A) and 0.89 in the validation group (Figure 5B). At 8 years, the AUCs were 0.81 and 0.85, respectively.
DISCUSSION
Our study presents the Argen-CHAG score, developed in a large and representative cohort of patients with positive serology for Trypanosoma cruzi treated in the public health system of the City of Buenos Aires. The model was constructed based on three simple and accessible predictors---age, LVEF, and ICD history ---and demonstrated excellent prognostic performance, with high and consistent discriminatory ability in both derivation and validation groups.
The score allows patients to be stratified into three clearly differentiated risk categories, with a net and clinically relevant mortality gradient. This classification can be very useful for identifying those who require closer follow-up, therapeutic intensification, or consideration of devices, while recognizing those at low risk, which avoids the overuse of resources. Thus, the model not only predicts but also offers a practical framework for clinical decision-making and resource optimization in contexts with high prevalence and structural limitations.
In Argentina, Chagas disease continues to be a significant cause of heart failure and sudden death. (11,12) Chronic Chagas cardiomyopathy (CCM) is associated with alarmingly high mortality, even higher than that observed in other forms of dilated cardiomyopathy. In a recent meta-analysis that included 37 studies and 17 949 patients, Gómez-Ochoa et al. demonstrated that patients with CCM have an almost twofold higher risk of mortality compared with those with non-ischemic and non-chagasic cardiomyopathies. (13)
The higher mortality rate of CCM can be explained by its particular pathophysiology, characterized by persistent myocardial inflammation, diffuse transmural fibrosis, diffuse myocardial fibrosis, malignant ventricular arrhythmias, and a high thromboembolic burden. Added to this is the absence of randomized clinical trials demonstrating the advantage of specific therapies in this population, suggesting that the benefit of conventional treatments for heart failure may not be comparable to those observed in other etiologies. (13-15) In the recently published PARACHUTEHF study, sacubitril valsartan, compared with enalapril, generated a greater reduction in natriuretic peptide values, without reducing cardiovascular mortality or the incidence of hospitalization for heart failure. (16)
Moreover, a systematic review and meta-analysis by Cucunubá et al. aimed to evaluate whether Chagas disease induces higher mortality compared with a control population with similar symptoms. This analysis included 25 studies with 10 638 patients and 53 346 person-years of follow-up, showing that Trypanosoma cruzi infection is associated with significantly higher mortality. The overall relative risk (RR) of death in patients with Chagas disease was 1.74 (95% CI 1.49-- 2.03) compared with uninfected individuals, with an annual mortality rate of 18% versus 10%, and an attributable risk of 42.5%. This excess mortality was observed in all clinical stages, although annual rates increased with severity (2% in asymptomatic patients, 16% in moderate-patients, and 43% in severe patients). However, a relevant limitation is the absence of studies conducted in Argentina. (17)
The Rassi score, published in 2006, represented a key progress in the prognostic stratification of Chagas disease. This model was developed from a Brazilian hospital cohort that initially included 424 patients, although the multivariate analysis was performed on 331 patients with complete data for all the variables evaluated. Patients were followed up for an average of 7.9 years to assess mortality. (9) However, its application has significant limitations outside the original context. First, the score was built with patients in advanced stages of the disease, which limits its extrapolation to populations with earlier or different clinical presentations. Furthermore, although the model performed well in Brazil, there are important differences in the manifestation and evolution of cardiac involvement between Brazil and Argentina, which reduces its validity for the Argentine population and highlights the need for locally validated prognostic tools.
Another notable limitation is the absence of variables derived from Doppler echocardiography in the original model. In recent years, this shortcoming has been one of the most questioned points, given that Doppler echocardiography is currently a fundamental tool, accessible in most health centers, with a consolidated prognostic value in the evaluation of cardiac function and structural heart diseases. (8,19) Finally, Rassi's model did not consider the inclusion of implantable devices, such as ICD, which are a current mainstay in the management of patients at high risk for ventricular arrhythmias and sudden death. (19-21)
Other recent studies have attempted to refine prognostic prediction in specific subgroups. Pereira et al. evaluated 117 CCM patients with ICD, observing a high incidence of appropriate therapies and a mortality rate of 6.2% person-years, predominantly due to refractory heart failure. In the multivariate analysis, secondary prevention, LVEF <30%, and intermediate Rassi score were associated with the occurrence of appropriate therapies, while functional class IV, LVEF <30%, and age >75 years were predictors of mortality. However, this was a single-center study, with a predominance of secondary prevention and a long inclusion period (2003-2021), which may have introduced heterogeneity in clinical management. (22)
Peixoto et al. developed and validated a specific prognostic score for CCM patients with pacemaker, a subgroup that was underrepresented in previous studies. They included 555 patients with an average follow-up of 3.7 ± 1.5 years and a cumulative mortality rate of 18%. They identified six independent predictors of mortality (right ventricular dysfunction, functional class III-IV, chronic kidney disease, left ventricular end-systolic diameter >44 mm, atrial fibrillation, and radiographic cardiomegaly) and classified patients into risk categories with mortality rates of 8%, 20.4%, and 51%. Although its clinical applicability is high, the study was single-center, without external validation, and with a visual assessment of right ventricular function, which may limit its reproducibility. (23)
This evidence reinforces the need to develop specific and locally validated prognostic tools, especially in contexts such as Argentina, where epidemiological, clinical, and socioeconomic characteristics differ from those observed in the Brazilian cohorts predominant in the literature. In addition, the country under study may reflect a differential distribution of T. cruzi genotypes, which are believed to influence disease progression and, therefore, mortality. This biological heterogeneity, coupled with differences in access to and quality of healthcare systems, reinforces the notion that scores derived from other populations cannot be directly extrapolated to the Argentine context, justifying the development of specific prognostic models such as the one presented here. (24)
Limitations
The retrospective nature of the study does not allow us to rule out the presence of residual confounding factors inherent in a non-randomized observational design.
CONCLUSION
Chagas disease continues to be a significant cause of morbidity and mortality, and there is lack of prognostic tools adapted to the Argentine reality. In this scenario, the ARGEN-CHAG model emerges as a simple, accurate, and easy-to-apply prognostic tool, developed from a representative cohort of the Argentine public health system. Its high discriminatory power, based on only three easily assessed clinical predictors, positions it as a valuable resource for optimizing risk stratification, guiding therapeutic decisions, and improving the follow-up of patients with Chagas disease in our country.
Acknowledgments
Our deepest and most sincere thanks go to the patients with Chagas disease who participated in this study, as their contribution and that of their families was essential to perform this work. Therefore, we hope to continue generating evidence that will allow us to improve the follow-up and care of this group of patients.
Conflicts of interest
None declared.
(See authors' conflict of interests forms on the web).