

In this new communication, we continue to develop the concept of physiologic and pathologic ventricular hypertrophy, as referred to in previous publications. (1,2)
Ventricular hypertrophy can be revealed by a simple, low-cost complementary test, such as an electrocardiogram (ECG), which also has the advantage of correlating well with cardiac magnetic resonance imaging (CMR). (3,4). The ECG enables the detection of multiple affected segments and their association, which is of utmost importance because it provides relevant information about a patient's cardiovascular health.
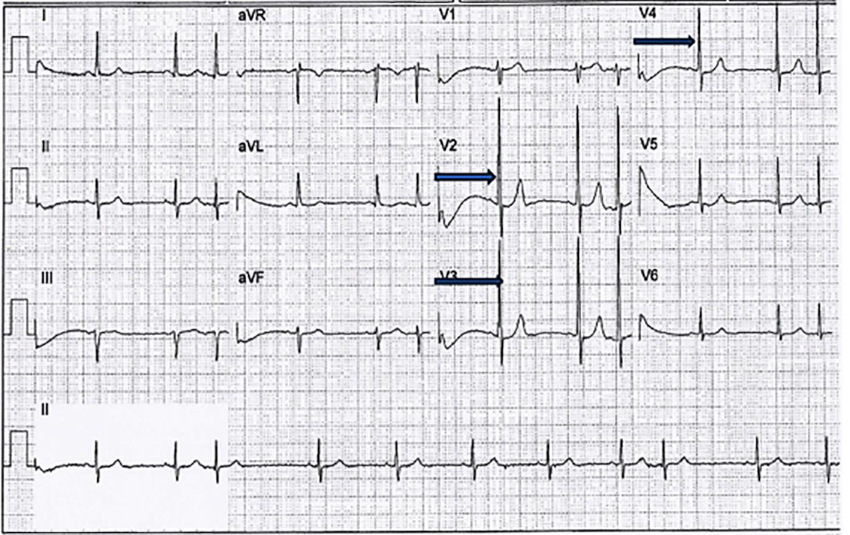
Through the ECG, we can differentiate between two types of hypertrophy. Physiologic hypertrophy occurs in the early stages in response to systolic overload, where there is an increase in ventricular wall tension as the first response according to Laplace's law. Consequently, physiologic hypertrophy develops, accompanied by a reduction in diastolic and systolic volume. (5) In this instance, there is an increase in the number of sarcomeres in series, which increases myocyte size as a result of the stimulation of catecholamines on alpha 1 and alpha 2 adrenergic receptors. In turn, arrestin, a protein that controls beta receptors (by blocking beta 3 receptors), is stimulated (as part of what is known as the fetal gene program). (6-8). This phenomenon manifests as narrow, high-voltage QRS complexes, isoelectric ST segments, and positive T waves on an ECG. This electrocardiographic pattern can persist for many years or evolve into pathologic hypertrophy because the biological factors that maintain physiologic mechanisms are exhausted, as occurs in advanced age in response to persistent systolic overload. In addition to beta-adrenergic receptors, myocytes and fibroblasts have angiotensin-2 receptors and endothelin-1 receptors. These receptors stimulate the formation of parallel sarcomeres, which contribute to increased myocyte diameter and fibrosis secondary to collagen deposition. This, in turn, promotes changes in the ECG that manifest as a QRS >120 milliseconds. (9,10) Fibrosis induces diastolic dysfunction, which is evidenced by ST-segment depression with or without negative T waves (Figure 1). This phenomenon can be observed in sustained hypertension, aortic stenosis, aortic regurgitation, as well as in the context following an acute myocardial infarction and other clinical conditions, where the myocardium undergoes various morphological adaptations with their corresponding electrocardiographic patterns. (11-12)
In the Department of Interpretation and Electrocardiography at Assuta Medical Center in Tel Aviv, Israel, with 30 years of experience in analyzing ECGs from patients from various centers, we have identified different types of hypertrophy, especially in subjects who have suffered a myocardial infarction. In these patients, we have observed hypertrophy primarily in the segments opposite the areas of necrosis.
We have described five different patterns of hypertrophy, each with its corresponding electrocardiographic expression. The different ECG patterns depend on a random distribution and concentration of the beta-adrenergic receptors, which help to regulate wall tension, and are distributed heterogeneously in the endocardium of the left ventricle.
Basal hypertrophy: This pattern is characterized by an R wave in aVL >10 mm and an S wave in LIII >10 mm. This type of hypertrophy is not adequately detected by echocardiography. Basal hypertrophy is very common because it forms part of the left ventricular outflow tract and is directly affected by systolic overload pressure. It occurs only in adults with hypertension, when there is an acute angle between the left ventricle and the aorta of 120 degrees (the normal value is approximately 150 degrees). This can be seen on the ECG. The QRS is narrow, the ST-segment is not depressed, and the T waves are positive. When the compensatory mechanisms are exhausted, the QRS broadens, and the ST segment becomes depressed, indicating myocardial fibrosis and impaired diastolic function.
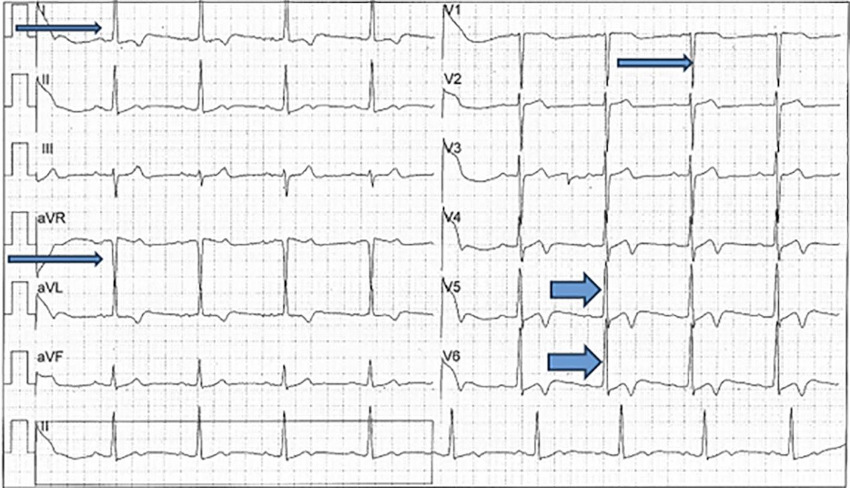
Apical hypertrophy: characterized by tall R waves in V4 (lower third of the anteroseptal septum), V5 (apex), and V6, which represents the lower third of the left lateral wall. These three segments are expressed together in almost all cardiac conditions because they originate from the same embryonic sac. Hypertrophy manifests as tall R waves in V4, V5, and V6, and giant T-wave inversion (>10 mm), present almost exclusively in this type of hypertrophy.
Posterosepal hypertrophy: characterized by S waves in V2 and V3 and, in some cases, even V4. It is a common pattern in clinical practice. In pathological cases, it is accompanied by other hypertrophied segments. The short R wave that accompanies the deep S waves is due to depolarization of the anterior wall occurring prior to depolarization of the hypertrophied posterior wall. There is also right axis deviation on the frontal plane, suggesting a backward and downward direction of the vector. After an anteroseptal myocardial infarction, posteroseptal hypertrophic remodeling can be observed on the ECG, manifested as deep S waves >20 mm.
Anteroseptal hypertrophy: the anterior septum may be affected in its upper, middle, or lower segment. It is characterized by tall R waves in V2, V2-V3, or V2-V4. We have observed that posterolateral myocardial infarctions are accompanied by anteroseptal hypertrophy, which is expressed by tall R waves in V1, V2, and V3.
Left lateral wall hypertrophy: This type of hypertrophy involves two segments:
- Mid-segment: characterized by tall R waves in LI, aVL (the R wave in LI is taller than in aVL), and S waves >10 mm in aVR and V1.
- Basal segment: R waves in aVL > LI.
As one would expect, the combination of multiple segments with physiologic or pathologic hypertrophy as a compensatory response is the most prevalent finding, and it can be observed on the ECG. The combinations occur randomly because they depend on each patient's phenotype due to the non-homogeneous concentration of receptors within the myocardium, as previously mentioned.
The following examples are combinations of multiple segments with hypertrophy, when at least two segments are involved.
The first case shows tall R waves in V2, V3, and V4, as indicated by the arrows, which indicate anteroseptal hypertrophy in the upper, middle, and lower segments. The QRS complex is narrow, the ST segment is isoelectric, and the T waves are positive. These findings indicate physiologic hypertrophy in an 84-year-old male patient with hypertension and diabetes (Figure 1).
In the second case, the tall R waves in LI and deep S waves in aVR and V1 indicate hypertrophy of the left lateral wall of the left ventricle in its middle segment (narrow arrows). The tall R waves in V5 and V6 show apical hypertrophy (thick arrows) (Figure 2).
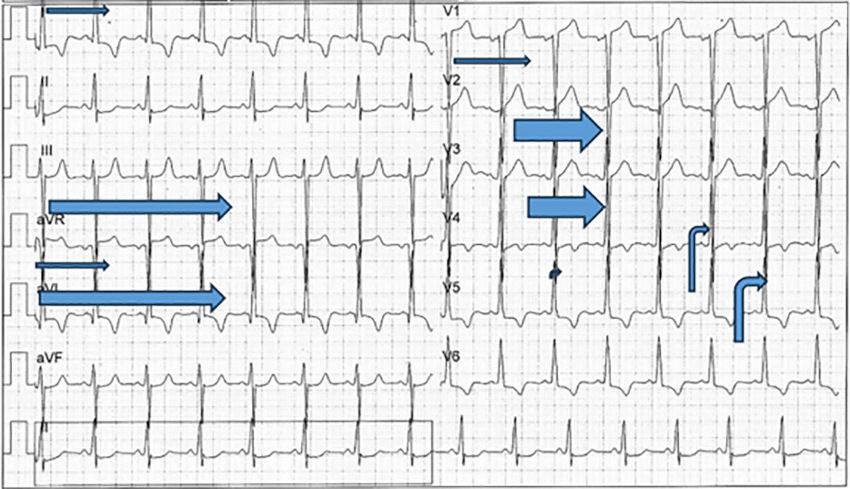
The third case shows hypertrophy of multiple segments. The tall R waves in LI and deep S waves in aVR and V1 indicate mid-lateral left ventricular hypertrophy (narrow arrows). The tall R waves in aVL and deep S waves in LIII suggest basal hypertrophy (long arrows). The deep S waves in V2 and V3 indicate posterosepetal hypertrophy (wide arrows). The tall R waves in V4 and V5 reveal apical hypertrophy (Figure 3).
Fig. 3.
Combination of multiple segments: mid-lateral, basal, posterosepetal, and apical hypertrophy
CONCLUSIONS
The ECG reveals distinct patterns of left ventricular hypertrophy, indicating the affected segments. In general, the hypertrophy affects multiple segments. Understanding the electrical expression of these segments helps us to comprehend the different phenotypes that manifest in combination.
Conflicts of interest
None declared.
(See authors' conflict of interests forms on the web).
Source of funding
None.