ORIGINAL ARTICLE
Cardiovascular Risk Profile in Women from Three
Different Areas of the Province of Tucumán, Argentina
Perfil de riesgo cardiovascular en mujeres de tres
entornos de la Provincia de Tucumán – Argentina
Damián Holownia1, Ricardo S. Galdeano1,2,
María S. Rojas Jordán1,2, Palavecino Darío Omar1,3, Abregú José Daniel1,4, Mario O. Martinengui1, Rodrigo O. Marañón1, 5, Claudio M. Joo Turoni
1
Tucumán District
– Sociedad Argentina de Cardiología
2
Sanatorio Racedo
(Monteros) – Tucumán
3
Provincial Health
System (Sistema Provincial de Salud, SIPROSA) –
Tucumán
4
Municipality
of Aguilares – Tucumán
5
Biomedical
Department, Institute of Physiology, School of Medicine, National University of Tucumán
(Universidad Nacional de Tucumán, UNT); Higher Institute of Biological Research (Instituto Superior de Investigaciones Biológicas,
INSIBIO)-National Scientific
and Technical Research
Council (Consejo Nacional de Investigaciones Científicas y Técnicas, CONICET) –
Tucumán
Address for reprints: Claudio M. Joo
Turoni. Departamento
Biomédico, Instituto de Fisiología, Facultad de Medicina, UNT; INSIBIO-CONICET.
Av.
Gral. Roca 1800, Tucumán.
Rev Argent Cardiol 2023;91:180-186. http://dx.doi.org/10.7775/rac.v91.i3.20629
ABSTRACT
Background: The role of the environment on
female population health in Tucumán has been little studied. This study aimed
to evaluate the cardiovascular risk profile in women from rural, peri-urban and urban areas in the province of Tucumán
(Argentina) and to analyse their differences.
Methods: An analytical cross-sectional study
was conducted in 3 groups of women from Tucumán: rural (n = 125), peri-urban (n = 50) and urban (n = 112).
Results: Blood pressure (BP) was
lower in the rural group; the urban group showed higher heart rate and smaller
neck circumference. Of the studied women, 29.7% were overweight and 42.4% obese, and no significant differences were found in the 3
groups. Increased neck circumference was observed in 62% of women in the rural
group, 79% in the peri-urban group and 41% in the
urban group (p <0.001). Smoking was more frequent in the urban group. In the
urban and peri-urban groups, the proportion of women
with higher education level was greater (p <0.001). Education level was
positively correlated with heart rate.
Conclusion: Regardless of the environment,
women from Tucumán are overweight or obese and have other risk factors for
cardiovascular disease. This should be considered when planning policies and
making decisions in order to improve their prognosis.
Keywords: Cardiovascular Disease - Women –
Environment
RESUMEN
Introducción:
El rol del entorno
sobre la salud en la población femenina de Tucumán está poco estudiado. El
objetivo del presente trabajo fue evaluar el perfil de riesgo cardiovascular de
mujeres de los entornos rural, periurbano y urbano de la provincia de Tucumán
(Argentina).
Material
y métodos: Se
efectuó un estudio analítico transversal en 3 grupos de mujeres de Tucumán:
rural (n=125), periurbano (n= 50) y urbano (n=112).
Resultados:
La presión arterial
(PA) fue menor en el grupo rural; el grupo urbano presentó mayor frecuencia
cardíaca y menor circunferencia de cuello. El 29,7% de las mujeres presentaron
sobrepeso y el 42,4% obesidad, sin diferencia significativa entre los 3 grupos.
La circunferencia de cuello estuvo aumentada en el 62% de las mujeres del grupo
rural, 79% del periurbano y 41% del urbano (p<0,001). El grupo urbano
presentó más frecuentemente tabaquismo. En los grupos urbano y periurbano fue
mayor la proporción de mujeres con estudios superiores (p <0,001). El nivel
educativo se correlacionó positivamente con la frecuencia cardíaca.
Conclusiones:
Independientemente del
entorno las mujeres de Tucumán presentan sobrepeso u obesidad asociados a otros
factores de riesgo para enfermedad cardiovascular. Ello debe ser tenido en
cuenta para la elaboración de políticas y la toma de conductas a fin de mejorar
su pronóstico.
Palabras
claves: Enfermedades
Cardiovasculares - Mujeres - Entorno
Received: 02/04/2023
Accepted: 05/06/2023
INTRODUCTION
Cardiovascular disease (CVD) is the leading cause of
morbidity and mortality worldwide (1) and in Argentina. (2) The so-called "social gradient" (decrease
in mortality and morbidity rates as social status increases) (3) has already been shown to
occur in a wide range of conditions, including CVD. (4)
In urban areas, population has easier access to health
services, but environmental factors, such as pollution, noise, and daily
stress, affect the cardiovascular health. (5) The peri-urban areas have
the disadvantage of being a transitional and unstable territory in terms of
social networks, which is associated with increased cardiovascular risk. (6,7) In addition, it has been conventionally described
that the prevalence of CVD is lower in rural areas. (8) However, this concept is changing, (9) since a high prevalence of
overweight was observed in different indigenous communities. (10,11) In Argentina, a 38% prevalence of metabolic syndrome
has been found in the Toba community (indigenous people living in central
Chaco). (12) More recently, we have found that the Quilmes community (rural
indigenous people living in the middle and high mountains who still preserves
pre-Inca traditions) in Tucumán has a prevalence of risk factors for CVD
similar to that in urban areas. (13)
The province of Tucumán, located in northwestern
Argentina, with an area of 22 525 km², has rural areas with difficult access,
densely populated urban areas (the capital city has 605 000 inhabitants in 91
km2) and strings of peri-urban areas surrounding the cities. In the urban and peri-urban areas of Tucumán, according to data from the
National Institute of Statistics and Censuses (Instituto
Nacional de Estadísticas y Censos, INDEC), the poverty rate was 42.7% in the second
quarter of 2022. (14) However, the impact of the environment on CVD risk
factors in women is still being studied. This view is consistent with the
worldwide literature which indicates that there is a dichotomy between real and
perceived CVD risk in women. (15,16)
This study aimed to evaluate the cardiovascular risk profile
in adult women from rural, peri-urban and urban areas
of the province of Tucumán (Argentina) and to analyse
their differences.
METHODS
An analytical cross-sectional study conducted in 3
population groups of women from different areas of Tucumán.
- Rural group: Women from Quilmes, a middle and high
mountain area where pre-Inca traditions are still preserved, who participated
in the Sonqo Calchaquí 2018
study (13) (n = 125).
- Peri-urban group: Women
from Villa Muñecas, a peripheral neighbourhood
located 3 km away from the city, who participated in a cardiovascular health
activity organized by the Argentine Society of Cardiology (Sociedad
Argentina de Cardiología, SAC), Tucuman District, on
Women's Day in March 2021 (n = 50).
- Urban group: Women living in the city of San Miguel
de Tucumán and performing desk jobs at the Municipality, who underwent a
cardiovascular health registry in September 2019 (n = 112).
In this study, the following variables were assessed:
- Age: Expressed in years.
- Education level: Expressed as completed level
(illiterate, primary school, secondary school or higher education).
- Presence of the following CVD risk factors: Smoking,
dyslipidemia, hypertension (HT) or diabetes. Women were asked about the
presence of said risk factors. A semiquantitative
score was made according to the number of risk factors mentioned (0 to 4).
- Salt added to cooked food.
- Weight (kg): It was measured with a digital scale.
- Height (cm): It was measured with a portable height
rod.
- Neck circumference (cm): It was measured with a
non-expandable measuring tape. It was considered increased when it was greater
than 34 cm. (17)
- Waist circumference (cm): It was measured with a
non-expandable measuring tape. It was considered increased when it was greater
than 88 cm. (17)
- Body mass index (BMI): It was calculated as weight
in kg/(height in m2. Women were classified
according to their nutritional status as follows: underweight (BMI <18.5);
normal weight (BMI ≥18.5 and <25); overweight (BMI ≥25 and
<30); obesity (BMI ≥30 and <35); severe obesity (BMI ≥35 and
<40); and morbid obesity (BMI ≥40).
- Systolic blood pressure (SBP) and diastolic blood
pressure (DBP) values were expressed in mmHg: It was measured with an Omron
7120® automatic digital sphygmomanometer according to the applicable
guidelines. (18) Pulse pressure (PP) was calculated as SBP - DBP and mean blood pressure
(MBP) as DBP + (PP/3).
- Heart rate and O2 saturation were measured with an An Mat® pulse oximeter.
Statistical Analysis
The results were compiled in a Microsoft Excel 2010
spreadsheet and expressed as percentage (%) or mean ± standard error, as
required. The statistical analysis was performed with GraphPad
Prism 5.02 software. Student’s t-test, ANOVA with Newman-Keuls’
post-test, Pearson’s correlation (r) or chi-square test (2) were used, as required.
Results were considered significant with a <5% probability (p <0.05).
Ethical Considerations
All participants granted the appropriate oral and
written informed consent to participate in this study.
RESULTS
The average age of the studied women was 48.9 ± 0.9
years, with no differences among the 3 groups: (rural: 50.2 ± 1.8 years, peri-urban: 47.7 ± 1.9 years, urban: 48.1 ± 1.0 years, p =
NS).
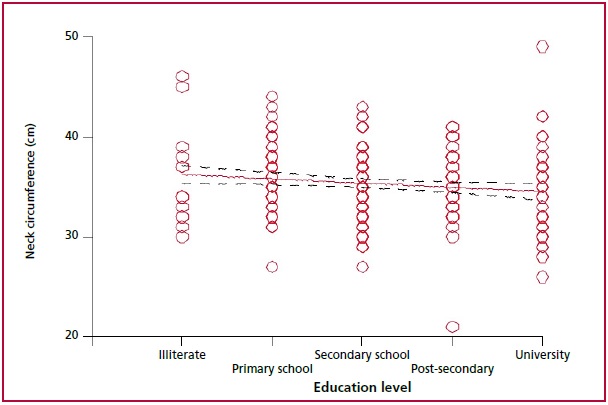
Education level of the studied women is shown in Figure 1. Illiterate women were
reported only in the rural group. The percentage of women with higher education
level was greater in the urban and peri-urban groups
than in the rural group (p <0.001).
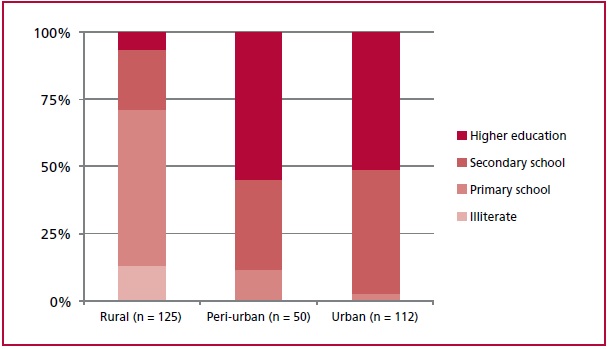
Fig. 1. Education level in the studied population.
Anthropometric and hemodynamic values are shown in Table 1. Weight and height values
were lower in the rural group than in the other two groups, but the average BMI
was elevated in all the studied population, with no differences among the 3
groups.
Table 1. Anthropometric values in the studied population
|
|
Rural (n = 125) |
Peri-urban (n = 50) |
Urban (n = 112) |
Total (n = 287) |
|
|
Weight (kg) |
68 ± 1 |
73 ± 2+ |
78 ± 2*** |
72.6 ± 1.0 |
|
|
Height (cm) |
154 ± 1 |
160 ± 1*** |
160 ± 1*** |
1.6 ± 0.1 |
|
|
BMI |
28.5 ± 0.5 |
28.5 ± 0.8 |
30.3 ± 0.6 |
29.3 ± 0.4 |
|
|
Neck circumference (cm) |
36.9 ± 0.8 |
36.1 ± 0.4 |
34.3 ± 0.4** |
35.7 ± 0.4 |
|
|
Waist circumference (cm) |
95.6 ± 1.3 |
97.9 ± 2.0 |
95.0 ± 1.8 |
95.8 ± 1.0 |
|
|
BP (mmHg) |
SBP |
123.7 ± 1.9 |
131.5 ± 2.4** |
131.2 ± 1.8*** |
128.0 ± 1.2 |
|
DBP |
75.6 ± 0.9 |
82.8 ± 1.9** |
80.7 ± 1.0** |
79.1 ± 0.7 |
|
|
PP |
44.9 ± 1.4 |
48.7 ± 2.0 |
50.5 ± 1.2** |
49.0 ± 0.8 |
|
|
MBP |
90.5 ± 1.2 |
99.0 ± 1.9*** |
97.6 ± 1.2*** |
94.7 ± 0.8 |
|
|
Heart rate (bpm) |
76.4 ± 1.2 |
78.4 ± 1.1 |
79.0 ± 1.1* |
77.6 ± 0.7 |
|
|
O2 saturation (%) |
94.9 ± 0.3 |
97.0 ± 0.2*** |
97.3 ± 0.2*** |
96.7 ± 0.2 |
|
*: p <0.05
vs. rural; **: p <0.01 vs. rural; ***: p <0.001 vs. rural; +: p <0.05
vs. urban. 0% 25% 50%
75% 100%
Neck circumference was smaller in the
urban group, but waist circumference was similar in the 3 groups. Although SBP
and DBP values, on average, remained within the normal rank, they were higher
in the peri-urban and urban groups than in the rural
group, and PP values were higher in the urban group than in the peri-urban group. Heart rate values were also higher in the
urban group, and O2 saturation was lower in the rural group.
When nutritional status was
evaluated, 27.9% of women showed normal weight; 29.7% was overweight and the
remaining 42.4% had some level of obesity (26.5% obesity; 10.6% severe obesity
and 5.3% morbid obesity). No underweight women were found. The nutritional
status distribution was similar in the 3 groups (p = NS).
Increased neck circumference was
observed in 62% of the women in the rural group, in 79% in the peri-urban group and in 41% in the urban group (p
<0.001) and increased waist circumference was observed in 69% of the studied
women, with no significant differences among the 3 groups.
The number of risk factors for CVD,
according to the semiquantitative score, was higher
in the urban group (Figure 2A). The proportion of women with no
risk factor was higher in the rural group (53%) than in the peri-urban
(44%) and urban (33%) groups (p <0.001). When each risk factor was analysed separately, HT was the most prevalent (30%),
followed by dyslipidemia (25%), smoking (23%) and diabetes (6%). The urban
group reported a higher percentage of smoker women (p <0.001). Similar
percentages for the other risk factors were found in the 3 groups (Figure 2B).
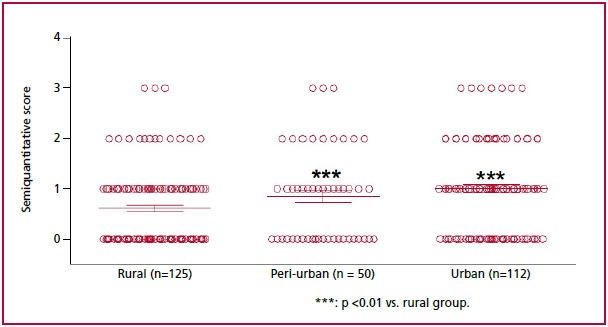
Red dots
represent each patient. Blue lines represent the mean ± standard error of each
group.
Fig. 2A. Number of risk factors for CVD in the studied groups.

Fig. 2B. Presence of the studied risk factors in each group.
Addition of salt to cooked meals was
observed in 47% of women. There were no significant differences regarding this
in the 3 groups.
A positive correlation was found
between neck and waist circumferences (r 0.65; 95% CI: 0.57-0.71; p <0.001).
At the same time, neck and waist circumferences were positively correlated with
BMI, the number of CVD risk factors and blood pressure (BP) (Table 2).
Table 2. Predictors of major cardiovascular events (cardiac surgery/death/acute
aortic syndrome)
|
|
Neck circumference |
Waist circumference |
|
BMI |
r: 0.62 95% CI: 0.54-0.69 |
r: 0.76 95% CI: 0.71-0.81 |
|
Number of risk factors |
r:
0.21 95%
CI: 0.09-0.32 |
r:
0.22 95%
CI: 0.11-0.33 |
|
SBP |
r: 0.31 95% CI: 0.19-0.41 |
r: 0.34 95% CI: 0.23-0.44 |
|
DBP |
r:
0.31 95%
CI: 0.20-0.41 |
r:
0.34 95%
CI: 0.23-0.44 |
|
PP |
r: 0.19 95% CI: 0.07-0.30 |
r: 0.21 95% CI: 0.09-0.32 |
|
MBP |
r:
0.33 95%
CI: 0.22-0.43 |
r:
0.36 95%
CI: 0.26-0.46 |
BMI: body mass
index; DBP: diastolic blood pressure; MBP: mean blood pressure; PP: pulse
pressure; SBP: systolic blood pressure.
r: Pearson's r coefficient; 95% CI: 95%
confidence interval.
In all
cases, p <0.001.
Education level was positively
correlated with heart rate (r 0.21; 95% CI 0.09-0.31; p <0.001) and O2
saturation (r 0.38; 95% CI 0.27-0.47; p <0.001) and negatively correlated
with neck circumference (Figure 3) and PP (r -0.1470; 95% CI: -0.26 to
-0.03; p <0.05). Age was positively but poorly correlated with neck
circumference, waist circumference, the number of risk factors, SBP and DBP,
but was not correlated with BMI (r: 0.06; 95% CI: -0.05-0.18; p = NS).
Education
level: fully completed education level. Pearson’s r: -0.13; 95% CI: -0.25 to -0,01; p <0.05.
Fig. 3. Correlation between the patients’ education level and the neck
circumference.
DISCUSSION
The main result of this study is
that, regardless of the area where the studied women live (rural, peri-urban or urban), they had increased BMI, large waist
circumference and high percentage of obesity. When observing the anthropometric
values in the 3 populations, women in the rural group showed lower weight;
however, as they also were smaller in height, they had a BMI similar to that of
the other two groups, suggesting that these differences could be racial rather
than nutritional.
It should be noted that 42.4% of the
studied women had some level of obesity. According to the 4th National Risk
Factor Survey (Encuesta Nacional
de Factores de Riesgo,
ENFR), (2) the
prevalence of obesity in Argentina was 33.4%, and 26.9% in Tucumán, without
discriminating by sex. The level of obesity observed in this study, which is
higher than that reported by the ENFR, (2) could be due to the fact that in the
rural and peri-urban groups, we studied women who
attended health services (which could be biased, since women with a lower BMI
may not have attended health services), and in the urban group, we studied
women who worked in offices –and therefore had a higher degree of sedentary
lifestyle. The high prevalence of obesity is worsened by the fact that 5.3% of
women are morbid obese. In addition, the increased waist circumference values
indicate central (abdominal) fat distribution. Central obesity is associated
with a poor quality diet and lack of physical activity. (19) Furthermore,
there is a direct relation between central fat distribution and CVD onset. (20) The presence
of central obesity indicates risk for CVD in the studied women, regardless of
the area where they live. This view is supported by the fact that neck
circumference –although, on average, had not increased– had changed in more
than half of the women, and its value was positively correlated with BMI, waist
circumference, BP and a number of CVD risk factors. In this regard, it has been
indicated that an increased neck circumference is associated with metabolic
alterations (21) and higher mortality, even with normal BMI. (22) Based on the
negative correlation between education level and neck circumference, we could
assume that higher education level is associated with better diet choice or
access to a healthier diet. In this regard, no differences were observed in the
addition of salt to food, so the diet of the 3 groups should be investigated in
future studies.
Women in urban areas have higher
prevalence of smoking, a fact that could dilute the protection suggested by
lower values of the neck circumference. In contrast to our findings, in a study
conducted in the USA it was found that in urban areas, where the education
level is higher, the prevalence of smoking is lower than in rural areas, (23) and in a
study conducted in China it was observed that education level was inversely
related to smoking. (24) The positive association between
heart rate and education level suggests greater stress in women with a higher
level of education, a fact that may be associated with increased smoking in
this population. In a population of recycling workers, it was shown that
elevated heart rate is associated with a higher degree of stress, (25) and under
laboratory conditions it was shown that stress increases cigarette consumption
in both men and women. (26)
Historically, regarding CVD risk
factors, the prevalence of CVD and diabetes has been higher in urban than in
rural populations. (8) Nowadays, this difference is
controversial. Decreased survival and increased CVD have been reported in
indigenous communities in several areas, including Australia, New Zealand, and
the United States. (9) More recently, our working group
found that in the Quilmes community, both men and women have a prevalence of
CVD risk factors similar to that in urban areas. (13) Interestingly, this trend is
replicated in the studied women of this population, which supports the
hypothesis raised in the previous paragraphs: regardless of the environment,
the levels of obesity and the cardiovascular risk profiles in women are
similar.
It should be highlighted, among other
points, that the BMI is within the overweight rank in the rural and peri-urban groups and within the obesity rank in the urban
group;
neck
circumference is higher in the rural and peri-urban
groups; the percentage of women without risk factors is higher in the rural
group; and smoking is higher in the urban group. However, the fact that the
distribution of body fat is similar (central type) in the 3 groups would
indicate a high risk for CVD in the entire studied population and a different
impact of the risk factors in the 3 groups, which suggests that the preventive
approach should also be differentiated.
Furthermore, although BMI did not
change with increasing age, we observed a correlation between age and waist and
neck circumferences, SBP, DBP, and the number of risk factors. It has been
shown that fat body mass increases and lean body mass
decreases with aging, (27) which could explain why BMI is maintained
over time.
CONCLUSIONS
Regardless of the environment (urban,
peri-urban or rural), women in Tucumán are overweight
or obese and have other risk factors for CVD, which could significantly affect
their cardiovascular health in the future. Although in all cases women should
be made aware of the benefits of a healthy diet and preventive lifestyle
including weight control, physical activity and stress reduction, in rural and peri-urban areas more emphasis should be given to improve
the level of education and access to healthcare systems, while in urban areas
the priority is to work on other aspects, such as smoking cessation.
Conflicts
of interest
None
declared.
(See
authors' conflict of interests forms on the web/Additional
material).
https://creativecommons.org/licenses/by-nc-sa/4.0/
©Revista Argentina
de Cardiología
1. GBD 2016 Mortality and Causes of Death Collaborators.
Global, regional, and national age-sex specifc
mortality for 264 causes of death 1980–2016: a systematic analysis for the
Global Burden of Disease Study 2016. Lancet 2016;390:1151–210. https://doi.org/10.1016/S0140-6736(17)32152-9
2. 4ta Encuesta Nacional de Factores de Riesgo. Ministerio de
Salud y Desarrollo Social. Presidencia de la Nación.
Argentina. 2019
3. Wilkinson RG, Marmot M. Social Determinants of Health:
the Solid Facts. 2nd ed. Copenhagen, Denmark: World Health Organization; 2003
4. Marmot M. Social determinants of health inequalities.
Lancet 2005;365:1099-104. https://doi.org/10.1016/S0140-6736(05)71146-6
5. Nieuwenhuijsen, MJ. Influence of
urban and transport planning and the city environment on cardiovascular
disease. Nat Rev Cardiol 2018;15:432–8. https://doi.org/10.1038/s41569-018-0003-2
6. Dhungana R, Thapa
P, Devkota S, Chandra Banik
P, Gurung Y Jahan Mumu S,
et al. Prevalence of cardiovascular disease risk factors: A community-based
cross-sectional study in a peri-urban community of
Kathmandu, Nepal. Indian Heart Journal 2018;70(Supp 3):S20-S27. https://doi.org/10.1016/j.ihj.2018.03.003
7. Abbs ES, Viñoles
J, Alarcón JO, Johnson H, Zunt
J. High prevalence of cardiovascular risk factors in Peruvian adolescents
living in a peri-urban shantytown: a cross-sectional
study. J Health Popul Nutr 2017;36:19.
https://doi.org/10.1186/s41043-17-0093-1
8. Barceló A. La diabetes en las Américas. Boletín Epidemiológico
OPS 2001;22:1-3.
9. Lucero A, Lambrick D,
Faulkner J, Fryer S, Tarrant M, Poudevigne M, et al.
Modifiable Cardiovascular Disease Risk Factors among Indigenous Populations. Adv Prev Med 2014;2014:547018. https://doi.org/10.1155/2014/547018
10. Pinto Garcia J, Lobo Cerna F,
Andrade Romero J, Soriano EM. Caracterización de los Factores de Riesgo
Cardiovascular para Infarto Agudo de Miocardio en Población Garífuna. Rev Cient Cienc
Med 2015;18:16-9. https://doi.org/10.51581/rccm.v20i1.152
11. Cataño Bedoya J, Duque Botero J, Naranjo González C, Rúa
Molina D, Rosique Gracia J, García Pineda A, et al. Prevalencia de factores de
riesgo cardiovascular en indígenas embera-chamí de Cristianía (Jardín), Antioquia. IATREIA 2015;28:5-16. https://doi.org/10.17533/udea.iatreia.18535
12. Lagranja E, Phojanakong
P, Navarro A, Valeggia C. Indigenous populations in
transition: An evaluation of metabolic syndrome and its associated factors
among the Toba of northern Argentina. Ann
Hum Biol 2015;42:84-90. https://doi.org/10.3109/03014460.2014.93
2008
13. Galdeano
R, Holownia D, Palavecino
D, Abregú J, Rivas Jordan M, Frías Silva M, et al.
Evaluación de variables cardiovasculares en una población calchaquí de media y
alta montaña de Tucumán. Rev Argent Cardiol 2021;89:20-6. https://doi.org/10.7775/rac.v89.i1.19095
14. Informes técnicos / Vol. 6, n° 60 ISSN 2545-6636.
Publicaciones del INDEC.
15. Kling J, Miller V, Mankad R,
Wilansky S, Wu Q, Zais T,
et al. Go red for women cardiovascular health–screening evaluation: The dichotomy
between awareness and perception of cardiovascular risk in the community. Womens Health 2013;22:210-8. https://doi.org/10.1089/jwh.2012.3744
16. Dearborn J; McCullough L. Perception of risk and
knowledge of risk factors in women at high risk for stroke. Stroke 2009;40:1181- 6. https://doi.org/10.1161/STROKEAHA.108.543272
17. Ben-Noun L; Arie LaorNeck E. Circumference as a Simple Screening Measure for
Identifying Overweight and Obese Patients. Obes
Res 2001;9:470-7. https://doi.org/10.1038/oby.2001.61
18. Sociedad Argentina de Cardiología. Consenso Argentino de
Hipertensión Arterial; Rev Argent Cardiol
2018;86 (Suppl 2):4-53. https://doi.org/10.7775/rac.v86.i4.13736
19. Xu F, Earp J, LoBuono
D, Greene G. The relationship of physical activity and
dietary quality with android fat composition and distribution in US adults.
Nutrients 2022;14:2804. https://doi.org/10.3390/nu14142804
20. Barroso T, Marins
L, Alves R, Souza Gonçalves
A, Barroso S, de Souza Rocha G. Association of
central obesity with the incidence of cardiovascular diseases and risk factors.
Int J Cardiovasc Sci 2017;30:416-24. https://doi.org/10.5935/2359-4802.20170073
21. Ataie-Jafari A, Namazi
N, Djalalinia S, Chaghamirzayi
P, Abdar M, Zadehe SS, et
al. Neck circumference and its association with cardiometabolic
risk factors: a systematic review and meta-analysis. Diabetol
Metab Syndr. 2018;10:72. https://doi.org/10.1186/s13098-018-0373-y
22. Sahakyan
KR, Somers VK, Rodriguez-Escudero
JP, Hodge DO, Carter RE, Sochor
O, et al. Normal-Weight
Central Obesity: Implications for total and cardiovascular mortality. Ann
Intern Med 2015;163:827-35. https://doi.org/10.7326/M14-2525
23. Doogan N, Roberts
M, Wewers M, Stanton C, Keith D, Gaalema
D, et al. A growing geographic disparity: Rural and urban cigarette smoking trends
in the United States. Preventive Medicine 2017;104:79-85.
https://doi.org/10.1016/j.ypmed.2017.03.011
24. Wang Q, Shen J, Sotero M, Li C, Hou Z. Income,
occupation and education: Are they related to smoking behaviors in China?. Plos One 2018;13:
e0192571. https://doi.org/10.1371/journal. pone.0192571
25. Burns K, Sun K, Fobil J, Neitzel R. Heart Rate, Stress, and Occupational Noise
Exposure among Electronic Waste Recycling Workers. Int. J. Environ Res Public Health
2016;13:140. https://doi.org/10.3390/ijerph13010140
26. Siegel A, Korbman M, Erblich J. Direct and indirect effects of psychological
distress on stress-induced smoking. Journal of Studies on Alcohol and Drugs
2017;78:930-7. https://doi.org/10.15288/jsad.2017.78.930
27. Holmes C, Racette S. The
Utility of Body Composition Assessment in Nutrition and Clinical Practice: An
Overview of Current Methodology. Nutrients 2021;22;13(8):2493.
https://doi.org/10.3390/nu13082493