Nuevas derivaciones electrocardiográficas y vectorcardiogramas regionales
Rev Argent Cardiol 2024;92:359-366. http://dx.doi.org/10.7775/rac.v92.i5.20824
SEE RELATED ARTICLE: Rev Argent Cardiol 2024:92:324-325. http://dx.doi.org/10.7775/rac.v92.i5.20826
Correspondence: Mario Jorge Mc Loughlin. E-mail:mario.mcloughlin@gmail.com
2024 ©Revista Argentina de Cardiología

INTRODUCTION
Precordial bipolar leads (PBL) have been described more than a century ago. In addition to the Lewis, Nehb, Cossio and Fontaine leads, (1,2,3,4) PBL are commonly used in operating room and intensive care monitoring and also in the Holter study. However, their use is empirical, not systematized and their electrodes are not the same as those of the standard ECG. In contrast, this review analyzes a new systematized electrocardiographic method that does not require additional cables or extra technical work, since it is based on the processing of data obtained from a simultaneous 12-channel digital electrocardiogram, either from a patient or stored in a database. (5,6) Recombination of recordings allows the creation of various bipolar leads, weighted unipolar leads and regional vectorcardiograms, as well as ECG circular charts. (7) These new presentations not only help in the detection of electrocardiographic pathologies, but also, as with PBL, show electrical phenomena in the right-left and anteroposterior axes that are not visible in the 12 standard ECG tracings.
RATIONALE FOR PRECORDIAL BIPOLAR LEADS (PBL)
A PBL measures the potential difference between two classic precordial electrodes, one designated as positive and the other as negative. It is important to remember that standard ECG precordial leads are unipolar leads (PUL), using the central Wilson terminal as neutral and an electrode applied to the skin as positive. By different combinations of PUL V1 to V6, up to 15 PBL can be generated, almost perpendicular to the midline joining the originating PUL, and study the cardiac sector between the two PUL electrodes. (8) For example, Fontaine lead II is similar to PBL V4-V1 or V5-V2. (4)
Therefore, PBL created from V1 to V4 explore the right-left axis, while V6-V3 does so in an oblique plane and V6-V4 examines the anteroposterior axis (Figure 1).
Fig. 1
Control patient. A. Standard simultaneous 12-channel ECG. B. Digital tracings of PUL in “A” differ in that they are plotted to show more detail, sacrificing the relative amplitude comparison. C. The 15 PBL that can be created with the standard ECG PUL, using the leftmost electrode as positive and the rightmost electrode as negative. Note that the lateral PBL (V6-V4 and V6-V5) have their positive electrode to the back, so they start with a significant Q wave, indicating that the initial vector has a posteroanterior direction. D. Comparative graph showing the PBL loop in the frontal plane, built using aVF as a cephalocaudal reference.
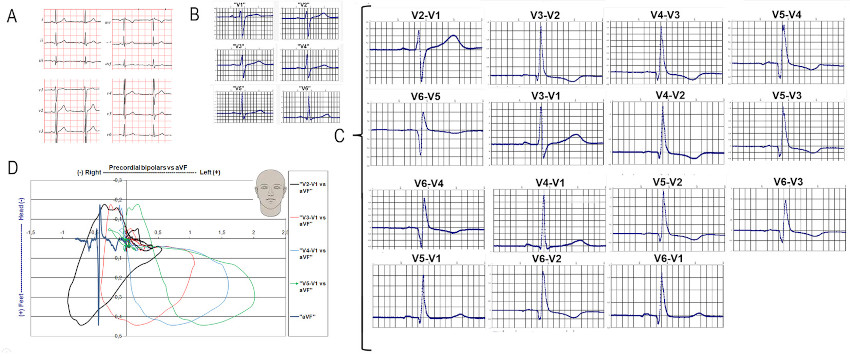
PBL: precordial bipolar lead; PUL: precordial unipolar lead.
DESCRIPTION OF THE NEW METHODOLOGY
This new technology involves the generation of PBL, weighted precordial unipolar leads (WPUL) and the construction of regional vectorcardiograms (VCGR), plotting a PBL versus a PUL or a WPUL. Moreover, since they are digital data, reliable measurements can be made of the time and amplitude of electrical phenomena, which is crucial for detecting time and amplitude alterations secondary to myocardial ischemia.
The digital ECG standards studied to apply our new methodology are from the STAFF III and PhysioBank ATM: PTB DIAGNOSTIC ECG databases, which are publicly available. (9,10,11)
Precordial bipolar leads (PBL)
It is important to remember that leads I, II and III of the standard ECG are bipolar. Therefore, PBL simply consist of selecting one of the precordial electrodes as the right arm (negative) and the other as the left leg or arm (positive). As a working rule, we have established that the leftmost electrode is considered positive [e.g., V2 (+) V1 (-), V6 (+) V1 (-), V6 (+) V4 (-), etc.].
Then, by comparing V2 with V1, we obtain PBL V2-V1, and by doing so between V6 and V4, we obtain PBL V6-V4. PBL V2-V1 is especially important, as it scans the retrosternal area and is highly sensitive to septal and right ventricular (RV) disorders.
Weighted precordial unipolar leads (WPUL)
Weighted precordial unipolar leads are created using complementary ratios of two PUL. The most common ratio is the average of the two (50% of each). Therefore, WPUL V2+V4 is equal to the average of both and should be equivalent to PUL V3 (or PUL V5 in the case of WPUL V4+V6). Similarly, WPUL V1+V2 would be equivalent to having an electrode in the middle of the sternum. This method has been validated in other publications (5,6,7) and is routinely used in many electrocardiographic machines to calculate some of the standard leads. (12,13)
Regional electrical activity loops (regional vectorcardiograms: RVCG)
These loops are created by combining classic PUL or WPUL with PBL, which are perpendicular to the former. Regional vectorcardiograms allow the study of the septum and anterior wall, (14) as well as the cardiac apex. (15) In addition, they magnify local electrical phenomena compared with other regions. To facilitate interpretation, especially for users unfamiliar with vectorcardiography, it is possible to add to these loops the tracings that give them origin. Using the coordinate axes to indicate time and voltage, the two measurements can be compared. For example, the “X” axis represents the voltage of the “right-to-left” lead, but also constitutes the time base for the anteroposterior lead (Figure 2). On the other hand, the opposite is true for the “Y” axis. This not only allows observation of the RVCG loop distortions, but also facilitates estimation of time and electrical amplitude of each phenomenon.
Fig. 2
Patient with RCA middle third occlusion. Panels a, b, c and g: retrosternal transverse plane. Panels d, e, f and h: retrosternal frontal plane. Panels a and d show only the unipolar lead and its influence on the loop (a: WPUL V1+V2 and d: aVF). Panels b and e show PBL V2-V1 and its influence on the loop. Panels c and f show the sum of the two leads and the loop they generate. Panels g and h integrate the traces and the RVCG loop. It is important to note that in the transverse plane there is continuity in the QRS complex loop and the T-wave loop, which generates the “omega” sign of ischemia. In all panels, the “X”, “Y” and “Z” axes represent time (milliseconds) for one tracing and amplitude (mV) for the other. In aVF, the positive vector is directed towards the patient's feet. Therefore, in these graphs, the aVF tracing is inverted compared with the standard ECG.
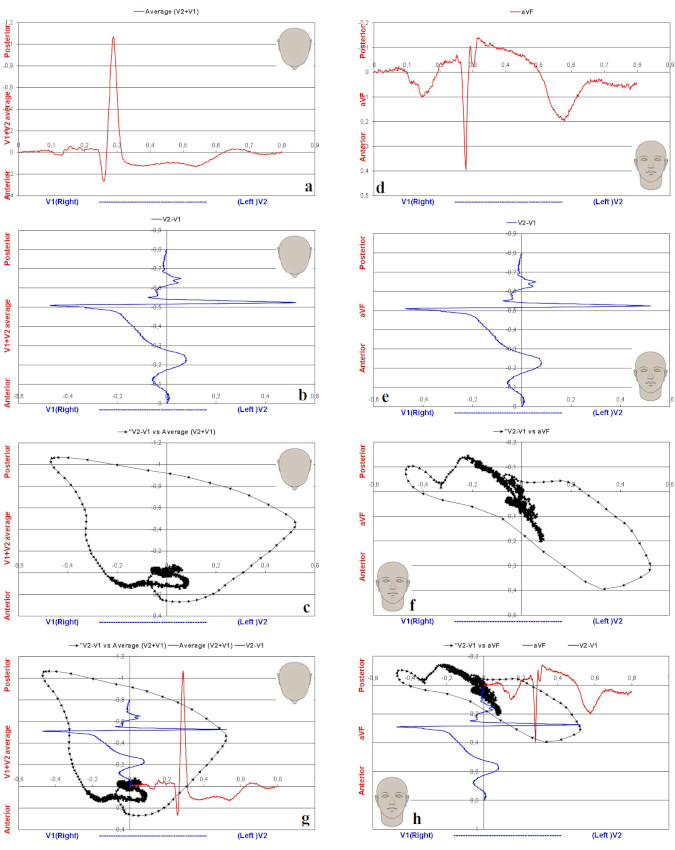
RCA: right coronary artery; PBL: precordial bipolar lead; RVCG: regional vectorcardiogram; WPUL: weighted precordial unipolar lead.
Monitoring the progress of cardiac activation (Circular ECG)
Unlike the ECG recording slip, the circular ECG presents all the leads of a plane superimposed in a circle, where the radius represents amplitude and the perimeter represents time. This representation facilitates the appreciation of temporal differences in electrical activity, which makes it especially useful for observing pre-excitation syndromes (Figure 3). (7)
Fig. 3
A. Normal circular ECG of the transverse plane (V1 to V6). B. Circular ECG in a patient with WPW syndrome. Depolarization is seen to begin in V6 (205 ms) while V2 and V1 show a delay (289 and 296 ms respectively). V1 peaks 91 ms after V6. The dissociation between left and right precordial leads suggests two different depolarization pathways. C. Circular ECG in LBBB. The typical “plateau” of V5 and V6 is observed, as well as the negative depression in V1 to V4. D. Circular ECG in a RBBB. A delay is seen in the final portion of V1 and V2. Normally, the delay in V1 is greater than in V2.

RBBB: complete right bundle branch block; LBBB: complete left bundle branch block; WPW: Wolf Parkinson White.
REPRESENTATION OF REGIONAL ELECTRICAL ACTIVITY
Since each PBL scans a particular region of the myocardium, it is not possible to analyze all of them in one review. Therefore, in this review we focused only on that related to the retrosternal area leads.
Weighted unipolar lead V1+V2 (WPUL V1+V2)
As mentioned above, this lead represents the average of the classic V1 and V2 leads. Therefore, it is positioned in the center of the sternum, perpendicular to PBL V2-V1. This spatial arrangement allows the construction of a RVCG that explores the retrosternal area in the transverse plane. In addition, using the cephalocaudal aVF lead associated with PBL V2-V1, a retrosternal frontal plane RVCG can be generated. In the latter case, although the amplitudes are slightly dissimilar, the spatial arrangement is maintained.
Precordial bipolar lead V2-V1 (PBL V2-V1)
This lead is similar to placing the right arm electrode in V1 and the left arm electrode in V2. It is one of the most useful leads because it examines the right-left axis of the retrosternal space, which is not explored in the standard ECG. The center of this lead is in the middle of the sternum and clearly defines the patient's electrical right and left. This distinction is important to contrast the differences between these new leads and those of the standard ECG; while in the latter it is accepted that the first vector is directed to the right, we have observed in 43 of 52 (83%) controls that in PBL V2-V1, the first vector is directed to the left (unpublished data). This discrepancy may be attributed to the fact that PBL V2-V1 only encompasses the retrosternal sector, whereas the traditional ECG considers the whole heart, resulting in different initial vectors.
Regional retrosternal vectorcardiogram (WPUL V1+V2 vs. PBL V2-V1 and aVF vs. V2-V1)
As mentioned above, the creation of these two RVCGs allows a three-dimensional appreciation of retrosternal electrical activity (Figure 2).
In the transverse plane, the efferent branch of the retrosternal RVCG QRS loop points to the left and forward while the afferent branch ends in the right and posterior quadrant, drawing an oval. In the case of anterior wall infarction, septal electrical forces are lost and the leftward deflection of PBL V2-V1 disappears (Figure 4, right panel). (12) In complete left or right bundle branch blocks, the loop formed by PBL V2-V1 vs. WPUL V1-V2 points backward. (7) PBL V2-V1 is especially useful in right coronary artery (RCA) occlusion because it shows a rightward shift of the ST-segment, suggesting right ventricular ischemia. (16)
Fig. 4
75-year-old male patient with a 2-day evolution anterior infarction. Tracings and retrosternal RVCG in transverse and frontal plane (A and B), standard ECG (C), PBL V2-V1 (D), and standard PUL V1 and V2 (E and F) are shown. In both RVCG, the bitten apple sign (arrows) is observed due to a rightward return of the initial portion of the QRS, indicating momentary predominance of the electrical forces from the right. Note that subtraction of the V1 recording (E) from V2 (F) causes the P negative portion of V1 to become positive, forming a bimodal P in the PBL (D). The PBL V2-V1 tracing shows a negative wave after the onset of the QRS which translates into the “bitten apple” sign in RVCG.

PBL: precordial bipolar lead; RVCG: regional vectorcardiogram.
NEW METHODS AND CARDIAC PATHOLOGY
Acute myocardial infarction
Because PBL V2-V1 focuses on the retrosternal region and excludes much of the left ventricle, the initial normal QRS vector, unlike the standard ECG, tends to point to the left. This transverse retrosternal RVCG loop is oval, counterclockwise, and passes through all four quadrants.
In patients with anterior myocardial infarction, necrosis overrides the electrical forces of the interventricular septum. (7) As a result, electrical forces from the right ventricle take on greater representation and deflect the vectors to the right. In this pathology, PBL V2-V1 may present three different patterns: a. QS (indicating absence of leftward forces in PBL V2-V1), b. Initial Q (i.e., the initial vector goes to the right) and c. Negative notch after the onset of the QRS wave, giving a “bitten apple” pattern in the RVCG of the area (Figure 4).
Hyperacute ischemia
Precordial bipolar leads have been shown to be particularly useful in the evaluation of ST-segment elevation in hyperacute ischemia. In a study of sixteen patients presenting with acute proximal left anterior descending artery (LAD) occlusion, the retrosternal transverse loop showed two typical patterns: 1. QRS folding or 2. QRS transport. 17
In turn, in a group of 45 patients, 16 with left anterior descending artery (LAD) occlusion, 17 with right coronary artery (RCA) occlusion and 12 with circumflex artery (Cx) occlusion, 100% showed lesion current in PBL V2-V1. (16-18) The direction of the lesion current varied in these patients: in 16 of the 45 patients (15 with LAD occlusion and 1 with RCA occlusion), the lesion current was to the left, whereas in the remaining 29 (1 with LAD occlusion, 16 with RCA occlusion and 12 with Cx occlusion), the lesion current was to the right. Importantly, these lesion currents, which are always present in the retrosternal loop, can coexist (especially in cases of Cx occlusion) with lesion currents of opposite direction in standard PUL V5 and V6. This may generate electrical cancellation on the 12-channel ECG (Figure 5). (16,17,18)
Additionally, the presentation of the loops in two axes or in three dimensions allows to clearly identify the J-point, the ST-segment deflections and the omega sign even when no displacement of this is observed in the standard ECG (Figure 5). (19)

Complete left bundle branch block (LBBB)
As mentioned above, PUL V5 constitutes the midpoint between PUL V6 and V4. When conduction disorders suppress the forward-pointing vectors, PBL V6-V4 tracing shows only an R wave, without the initial Q seen in healthy patients. In cases of LBBB, where the initial septal depolarization is abnormal, the entire QRS loop observed from PBL V6-V4 is posterior to the PUL V5 axis. In addition, because in LBBB, PUL V1 and V2 have the same negative amplitude and are almost simultaneous (both electrodes are stimulated at almost the same time), PBL V2-V1 will be of very small amplitude and will only show the slightest differences between the two in time. (5,6,7) The circular ECG will very clearly show the delayed activation with a typical wide-mouth “pac-man” figure in the right precordial leads and a “plateau” figure in the left leads (Figure 3, panel C).
Complete Right Bundle Branch Block (RBBB)
In patients with RBBB, the final QRS forces in PUL V1 show a significant delay, with an increase in voltage, so that it always appears posterior to the PUL V2 peak R wave. Also, the normal time difference between the intrinsic deflection of PUL V6 and PUL V1 is reduced. (5,6,7) In the circular ECG, the delay of the PUL V1 peak R wave is clearly observed (Figure 3, panel D).
Arrhythmias
Because these new methods analyze only one beat at a time, the investigative or diagnostic value of this methodology is limited. Figure 6 shows the onset of an arrhythmia after balloon inflation in the proximal LAD. Only an interval of approximately fifty milliseconds from the onset of the arrhythmia is shown, which was examined using different RVCG. 19
Fig. 6
Onset of an arrhythmia as seen from different RVCG. The first 393 ms and the last 350 ms of the QRS loops have been removed to show the onset of the arrhythmia. Panel (a): PBL V2-V1 vs. WPUL V1+V2. Panel (b): PBL V4-V2 vs. WPUL V3. Panel (c): PBL V6-V4 vs. PUL V5. Panel (d): PBL V2-V1 vs. aVF. The initial tracing shows the last 15 milliseconds of the normal beat before the arrhythmia, which begins at 408 ms. In the 3 panels of the transverse plane, the vectors at the end of the normal beat and at the beginning of the ectopic beat are almost identical, but of opposite direction, whereas in the frontal plane (d), there is a U-turn with the normal part slightly more caudal than the abnormal one. It should be noted that when the observation point varies from (a) to (b), there is a specular inversion of the tracing. In (c), the phenomenon is observed from the lateral side (PBL V6-V4 vs. PUL V5) and the tracing of the arrhythmia onset is reduced to one point.

PBL: precordial bipolar lead; PUL: precordial unipolar lead; RVCG: regional vectorcardiogram; WPUL: weighted precordial unipolar lead.
In the case of pre-excitation syndromes, the circular ECG shows with high accuracy the activation sequence of the various ECG leads, and allows clear identification of the area that depolarizes first (Figure 3, panel B).
CONCLUSION
Although electrocardiography is almost 150 years old, this new information supports the implementation of new electrocardiographic diagnostic methods, resulting in a valuable addition to current clinical practices. Weighted PUL that match PUL V3 and V5 allow verification of correct electrode positioning. Moreover, PBL, due to their proximity to the myocardium, provide signals of higher amplitude and quality, with a better signal-to-noise ratio (PBL V6-V1 is similar to the standard ECG lead I, but with much higher amplitude and signal-to-noise ratio). Given that PBL V2-V1 has a high sensitivity for detecting ischemic ST-segment changes, it would be highly desirable to use it in patients with suspected acute myocardial infarction. This would involve repeating the ECG but placing the electrode of the right arm in V1 and that of the left arm in V2.
Although experienced cardiologists can make accurate diagnoses with the traditional ECG, it is important to consider that electrocardiograms are often interpreted by less experienced physicians, for whom any assistance would be beneficial. Therefore, it would be desirable to incorporate an algorithm into electrocardiography machines to show the additional diagnostic information provided by this new methodology.
In addition, it is important to keep in mind that many hospitals store their electrocardiograms in databases. The ability to access these records and reprocess data from prior studies could reveal new signs of previously undocumented pathologies. (20)
Ethical considerations:
The authors report that approval by the corresponding ethics committee does not apply.
An informed consent request does not apply.
Artificial intelligence was not used in this article.
There was no sex or gender bias in the present work.
Financing:
None.
REFERENCES
2. Nehb W. Zur Standardisierung der Brustwandableitungen des Elektrokardiogramms. Mit Bemerkungen zum Friihbild des Hinterwandinfarkts und des Infarktnachschubs in der Vorderwand. Klin. Wochenschr 1938;17:1807-11. https://doi.org/10.1007/BF01766532
3. Cossio P, Bibiloni A. Horizontal Bipolar Leads. Am Heart J 1956;51:366-77. https://doi.org/10.1016/0002-8703(56)90062-X
4. Fontaine G, Fontaliran F, Hébert JL, Chemla D, Zenati O, Lecarpentier Y, et al. Arrhythmogenic right ventricular dysplasia. Annu Rev Med. 1999;50:17-35. https://doi.org/10.1146/annurev.med.50.1.17
7. Mc Loughlin MJ. Electrocardiograma de coordenadas polares: una representación gráfica diferente para estudiar los vectores e interpretación de ECG. Pren Med Arg 2020;106:592-601. https://prensamedica.com.ar/LPMA_V106_N10_P592_es.pdf
8. Mc Loughlin MJ, Di Diego JM: Pathophysiology of myocardial currents of injury revisited. J. Electrocardiol 2022;74:54-58. https://doi.org/10.1016/j.jelectrocard.2022.08.001
9. Bousseljot R, Kreiseler D, Schnabel A. Nutzung der EKG-Signaldatenbank CARDIODAT der PTB über das Internet. Biomed Tech (Berl). 1998;43 Suppl 3:73-6. Physikalisch-Technische Bundesanstalt (PTB), del Instituto Nacional de Metrología de Alemania. https://archive.physionet.org/cgi-bin/atm/ATM [PTB Diagnostic ECG Database (pbtdb)].
10. Goldberger AL, Amaral LA, Glass L, Hausdorff JM, Ivanov PC, Mark RG, et al. PhysioBank, PhysioToolkit, and PhysioNet: components of a new research resource for complex physiologic signals. Circulation. 2000;101:E215-20. https://doi.org/10.1161/01.CIR.101.23.e215
11. Martínez JP, Pahlm O, Ringborn M, Warren S, Laguna P, Sörnmo L. The STAFF III Database: ECGs Recorded During Acutely Induced Myocardial Ischemia. Comput Cardiol. 2017;44. https://doi.org/10.22489/CinC.2017.266-133
14. Mc Loughlin MJ. Precordial bipolar leads: A new method to study anterior acute myocardial infarction. J Electrocardiol 2020;59:45-64. https://doi.org/10.1016%2Fj.jelectrocard.2019.12.017
15. Mc Loughlin MJ, Konoptka IV. Right to left T wave discordance in Acute Myocardial Infarct: a new electrocardiographic sign. J Electrocardiol 2020;63:134-8. https://doi.org/10.1016/j.jelectrocard.2020.11.002
16. Mc Loughlin MJ, Di Diego JM. Right ventricle injury in RCA occlusion: Exploration using precordial bipolar leads and surrogate vectorcardiograms. J Electrocardiol 2023;73:89-96. DOI: https://doi.org/10.1016/j.jelectrocard.2023.03.01
17. Mc Loughlin MJ, Mc Loughlin DE. Abnormal myocardial activation as a cause of ST elevation: A study using Precordial Bipolar Leads (PBL). Curr Probl Cardiol 2022. In press. https://doi.org/10.1016/j.cpcardiol.2022.101163
18. Mc Loughlin MJ, Di Diego JM. Ventricular injury in acute left circumflex occlusion: Exploration using precordial bipolar leads and regional vectorcardiograms. J Electrocardiol 2024;8:81-7. https://doi.org/10.1016/j.jelectrocard.2024.03.012
19. Mc Loughlin MJ, Di Diego JM. Review on new ECG-derived leads and regional vectorcardiograms. J Electrocardiol. 2023;81:13-9. https://doi.org/10.1016/j.jelectrocard.2023.07.004
20. Mc Loughlin MJ, Brugada P. Access to ECG raw data can help researchers, physicians and patients. Curr Probl Cardiol 2021;46:100659. https://doi.org/10.1016/j.cpcardiol.2020.100659