Del estudio observacional y el ajuste a la decisión clínica. Parte 1
Rev Argent Cardiol 2024;91:293-2974. http://dx.doi.org/10.7775/rac.v92.i4.20804
Received:: 06/06/2024 Accepted:: 07/16/2024
Correspondence: Arturo Cagide. E-mail: arturo.cagide@hospitalitaliano.org.ar
MTSAC Miembro Titular de la Sociedad Argentina de Cardiología

In recent bibliographic reports the statistical methodology is not the usual one, with terms, tables, and charts that may sometimes be hard to understand, particularly when it comes to making clinical decisions.
Here are some examples.
Trial 1.
The aim of this observational study was to compare medical treatment (MT) and percutaneous coronary intervention (PCI) in patients with chronic angina. (1) A total of 9586 patients were included and 1866 were matched in 933 pairs (MT/PCI). The balance between baseline patient characteristics in the paired groups was appropriate. Unadjusted and adjusted hazard ratios (HR) calculated by the Cox model of MT/PCI for the primary endpoint of mortality were 1.50 and 1.49, respectively. (Table 1). The authors conclude that mortality is 49% higher with MT than with PCI.
Table 1.
Trial 1. Event rate with medical treatment (MT) and with percutaneous coronary intervention (PCI), and adjusted and unadjusted HR in 933 matched pairs in a model with 20 covariates (modified from reference 1).
n= 9586. Matched pairs (n=933) by propensity score (933 MT/933 PCI).
| MT / PCI | MT | PCI | MT / PCI | p | MT / PCI | p |
|---|---|---|---|---|---|---|
| Result (4 years) | % / 4 a | % / 4 y | Adjusted HR | value | Unadjusted HR | value |
| Mortality / infarction | 21.6 | 16.5 | 1.49 | 0.002 | 1.50 | 0.002 |
Trial 2.
The aim of this study was to investigate whether prior statin therapy translates into a lower incidence of heart failure in patients hospitalized for acute coronary syndrome. (2) This was a non-randomized observational trial comparing two groups, one with statins and another without statins prior to the acute event. The inverse probability of treatment weighting (IPTW, see explanation below) was used to balance different baseline characteristics and the standardized difference to estimate the level of adjustment. Table 2 summarizes the study in terms of the adjustment achieved and the trial outcome expressed as relative risk. The authors conclude that patients with acute coronary syndrome previously treated with statins have a better clinical outcome.
Table 2. Trial 2.
The covari ates adjusted for IPTW (inverse probability treat ment weighting) with the standardized difference af ter adjustment are shown above. Below, heart failure rates with and without prior statins, and the HR between both groups after IPTW. (Modified from reference 2) Quantitative variables are presented as mean and stan dard deviation, and qualita tive variables as percentages
Trial 3
The aim of this observational study was to evaluate the role of oral anticoagulation after atrial fibrillation catheter ablation to prevent systemic thromboembolism and bleeding complications in subgroups according to the CHADS2 score. (3) The authors used different statistical strategies, including IPTW.
Figure 1 shows the standardized difference in baseline characteristics before and after adjusting for IPTW. The acceptance level is <0.10. For the example, the effect of anticoagulation was only considered in the CHADS2 score ? 1. The result was expressed as HR by IPTW (primary endpoint), by propensity score matching (PS), and by the Cox proportional hazards model (secondary endpoints).
Figure 1 Trial 3.
Standardized difference of more than 40 covariates between groups with and without anticoagulation, before and after adjustment for IPTW in CHADS2 score ≤ 1 and CHADS2 score = 2. The limit was set at 0.10. Confounders were well-balanced after adjustment. The difference was significantly higher in CHADS2 score ≤1 before adjustment, indicating that this group was more heterogeneous in terms of confounding variables. (Modified from reference 3)
AF: atrial fibrillation; IPTW: inverse probability treatment weighting
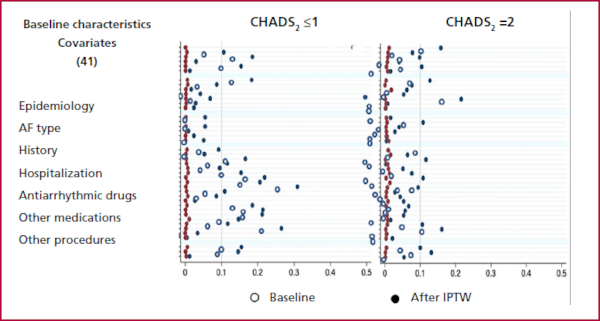
Table 3 shows the effect of anticoagulation on thromboembolism and major bleeding in CHADS2 score ? 1. (The subgroups with CHADS2 score = 2 and CHADS2 score ? 3, which were not considered for this methodological analysis, were also analyzed). Figure 2 shows the incidence of thromboembolism and major bleeding with and without anticoagulation in the CHADS2 score ? 1 subgroup after adjusting for IPTW.
Table 3 Trial 3.
Effect of anticoagulation after atrial fibrillation catheter ablation on thromboembolism and major bleeding in the subgroup with CHADS2 score ≤ 1. The result, expressed in HR and its confidence interval is presented according to three statistical methods. (Modified from reference 3)
Figure 2
Trial 3. Incidence of events with and without anti coagulation after atrial fibril lation catheter ablation for the IPTW-adjusted popula tion in the CHADS2 subgroup ≤ 1. There were no differenc es in the incidence of embo lism, but major bleeding was significantly higher (log rank test) in subjects who contin ued with anticoagulation. (Modified from reference 3)

The authors conclude that in CHADS2 score ≤ 1 anticoagulation does not provide any benefit for the prevention of thromboembolism and is associated with higher bleeding rate.
Trial 4
The aim of the investigation was to determine the risk (prognostic criterion) of type 2 myocardial infarction compared to type 1. (4) Figure 3 illustrates the standardized difference before and after adjustment of several baseline characteristics. The authors highlight that the prognosis for both types of myocardial infarction was similar. However, the detailed analysis in Figure 3 shows differences compared to Figure 1 that could call into question any conclusion about the prognostic value, independent of the type of infarction.
Fig. 3
Trial 4. The chart is qualitatively similar to that of Fig. 3. In this case, the ad justment limit was set at 0.20. The differences after adjust ment are close to 0.10, which is significantly higher than in the previous example. (Modi fied from reference 4).
ACS: acute coronary syndrome; COPD: chronic obstructive pulmonary disease; KK: Killip and Kimball; PVD: peripheral vascular disease; SBP: systolic blood pressure.

Trial 5
The focus of this investigation differed from the one of the trials mentioned before. (5) The authors wanted to evaluate the natural history of aortic stenosis according to its severity. Although a significant percentage of the sample underwent valve implantation or aortic valve replacement, the aim of the investigators was not to compare the groups with and without intervention, but rather to analyze the spontaneous disease progression. The IPTW methodology was used to adjust for the informative censoring caused by the intervention. Based on the findings presented in Table 4 (adjusted and unadjusted mortality), the authors conclude that the population not intervened represents the natural history of aortic stenosis.
Table 4. Trial 5.
Mortality rate in a sample of patients with different grades of severity of aortic stenosis with medical treatment and after adjustment for IPTW. The aim was to adjust for the informative censoring caused by the intervention (valve implantation or replacement). The absence of differences indicates that the medical treatment group is not a selected (biased) population by the intervention. See the explanation in the text. (Modified from reference 5).
| Aortic stenosis | Mortality (%/4 years) | |
|---|---|---|
| Unadjusted | Adjusted | |
| No | 13.5 | 13.5 |
| Mild | 25.0 | 25.0 |
| Mild to moderate | 29.9 | 29.7 |
| Moderate | 33.5 | 33.2 |
| Moderate to severe | 45.7 | 42.2 |
| Severe | 44.9 | 42.0 |
Observational studies
The common denominator of the bibliography mentioned can be summarized in the following points:
-
design: observational study
-
objective: to evaluate the effect of an exposure variable (intervention or prognostic criterion) on an outcome variable and estimate the possible association between both variables.
-
difficulty: the baseline characteristics of the sample may influence the relationship mentioned above; for this reason, they are often referred to as confounding variables or simply confounders.
-
to affect the association of interest, confounders must be associated with the exposure variable and with the outcome variable.
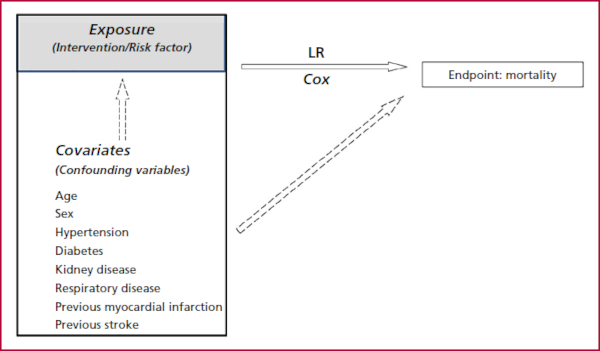
Perhaps an example will illustrate this point (Figure 4): the outcome variable or study endpoint can be associated with the exposure variable (research objective) but also with a certain number of confounding factors that can influence this association. For example, if an intervention, which can favorably modify the end point, is preferentially indicated for younger patients, this benefit could be attributed to the treatment itself or to the fact that the procedure "selected" young individuals at lower risk. (The example can be extended to a trial investigating the value of a new prognostic criterion). In other words, any imbalance in the prevalence of confounding factors may affect the association that was the research objective.
Fig. 4
Multivariate study. Exposure variable (interven tion or risk factor, depending on the research objective), and its possible association with the outcome variables (solid arrow). If confounding variables are also associated with the exposure and the outcome variable (dashed ar rows), they could attenuate or dilute the exposure/out come association. The mul tivariate analysis of the set (box) estimates the "adjust ed" association between the exposure and the outcome variable, independently of the confounding variables
In randomized (experimental) trials, the indication for intervention is not based on a medical decision but on random allocation. This distributes potential confounding factors uniformly across both groups with and without intervention, so that the exposure/outcome association is "independent" of its effects. However, randomization can sometimes fail, especially if the sample size is small.
The usual procedure to solve the problem is multivariate analysis, logistic regression or time-to-event analysis in the Cox proportional hazards model (hereafter "Cox model").
This methodology entails the simultaneous analysis of the exposure variable and the selected confounders, which are identified as having either an isolated statistical association or a prior bibliographic contribution ( independent variables ). (Figure 4). This procedure is usually referred to as adjustment. If the multivariate analysis determines that the exposure reaches statistical significance, we can conclude that it affects the outcome variable ( dependent variable ) since this association is not conditioned by the confounders.
Multivariate analysis requires a certain proportion between the number of independent variables and the prevalence/incidence of the outcome variable, which in certain circumstances may restrict the applicability of the methodology.
In the second part of this review, we will examine more recent statistical methods used in the statistical analysis of observational studies.
REFERENCES
1. Hannan EL, Samadashvili Z, Cozzens K, Walford G, Jacobs AK, Holmes DR Jr, et al. Comparative outcomes for patients who do and do not undergo percutaneous coronary intervention for stable coronary artery disease in New York. Circulation 2012;125:1870-9. https://doi.org/10.1161/CIRCULATIONAHA.111.071811 .
2. Bugiardini R, Yoon J, Mendieta G, Kedev S, Zdravkovic M, Vasiljevic Z, et al. Reduced Heart Failure and Mortality in Patients Receiving Statin Therapy Before Initial Acute Coronary Syndrome. J Am Coll Cardiol 2022;79:2021-33. https://doi.org/10.1016/j.jacc.2022.03.354 .
3. Kanaoka K, Nishida T, Iwanaga Y, Nakai M, Tonegawa-Kuji R, Nishioka Y, et al. Oral anticoagulation after atrial fibrillation catheter ablation: benefits and risks. Eur Heart J 2024;45:522-34. https://doi.org/10.1093/eurheartj/ehad798 .
4. Kanaoka K, Nishida T, Iwanaga Y, Nakai M, Tonegawa-Kuji R, Nishioka Y, et al. Oral anticoagulation after atrial fibrillation catheter ablation: benefits and risks. Eur Heart J 2024;45:522-34. https://doi.org/10.1093/eurheartj/ehad798 .
5. Généreux P, Sharma RP, Cubeddu RJ, Aaron L, Abdelfattah OM, Koulogiannis KP, et al. The Mortality Burden of Untreated Aortic Stenosis. J Am Coll Cardiol 2023;82:2101-9. https://doi.org/10.1016/j.jacc.2023.09.796 .