

Introduction
Cardiovascular genetics is no longer limited to rare hereditary diseases but is rather being gradually integrated into daily practice. Nowadays, concepts such as genetic susceptibility, modifier variants, and polygenic risk play an increasingly important role in cardiovascular assessment. However, the association between genetics and cardiovascular disease is rarely linear. The same variant can be expressed differently among individuals, and many common diseases result from the cumulative effect of multiple variants with small effect size, combined with environmental factors.
In this context, the challenge for the clinical cardiologist is no longer the mere identification of mutations, but the understanding of how genetic information can help better interpretation of risk, phenotypic heterogeneity, and variability.
From genotype to phenotype: penetrance, expressivity, and modifiers
The presence of a genetic variant does not necessarily determine a uniform clinical expression. Patients with the same genotype may exhibit differences in penetrance, severity, age of onset, and affected organs, reflecting the influence of genetic, epigenetic, and environmental modifiers or conditioning factors on the final phenotype (Figure 1) (1)
Fig. 1
Conceptual diagram of the relationship between genotype and phenotype in hereditary diseases
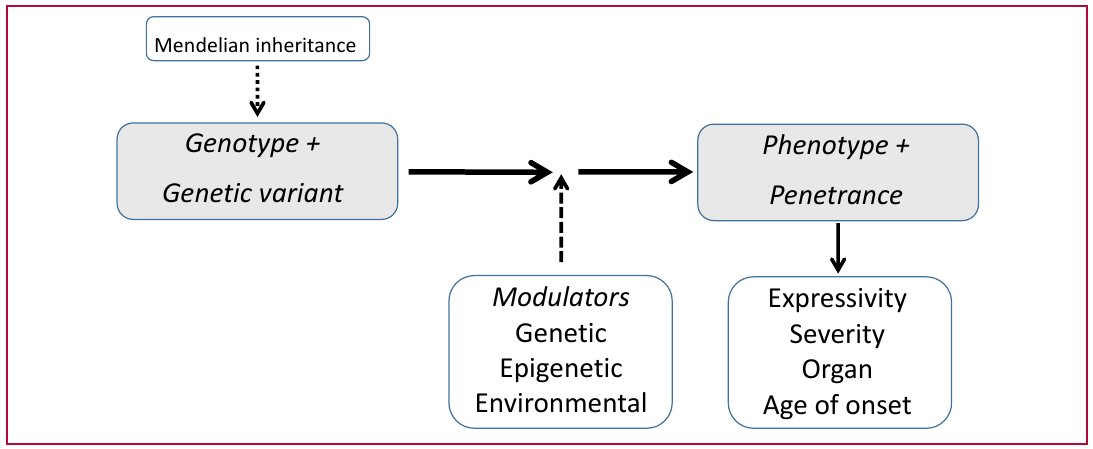
A genetic variant with a possible Mendelian pattern may be associated with a positive phenotype with variable penetrance. The final phenotypic expression may be modulated by genetic, epigenetic, and environmental factors, leading to differences in expressivity, severity, affected organ, and age of onset.
Monogenic variants are typically associated with high penetrance and lower-frequency phenotypes with larger biological effect sizes, which facilitates their clinical and familial recognition. In contrast, polygenic variants consist of multiple single-nucleotide polymorphisms (SNPs) of small individual effect sizes that are common in the general population, driving a more gradual and probabilistic phenotypic expression.
Both monogenic and polygenic variants represent extremes of a biological continuum rather than completely separate entities; thus, in clinical practice, these two mechanisms often interact. Even in diseases considered monogenic, penetrance and expressivity can be modified by polygenic variants, epigenetic mechanisms, and environmental factors. This helps explain the clinical heterogeneity observed among patients carrying the same genetic variant, including differences in severity, age of onset, and organ involvement (Figure 2). (2)
Fig. 2
Large or intermediate-effect size monogenic variants and polygenic variants associated with SNP summation
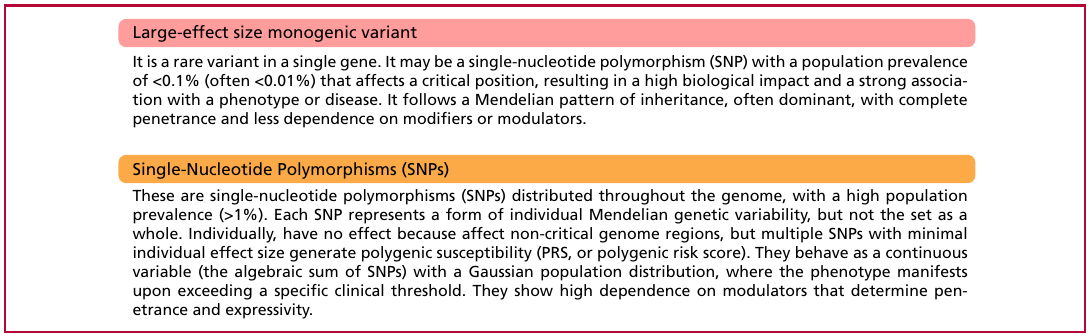
The distinguishing characteristics of monogenic and polygenic variants are described in terms of penetrance, population frequency, magnitude of the biological effect size, and phenotypic distribution pattern.
A possible third group consists of monogenic variants with intermediate effect sizes, which exhibit characteristics that fall between those of the previous categories.
While even a single DNA base change can cause a genetic alteration, its clinical impact is ultimately determined by the functional region involved. Variants located in critical regions of a gene can modify essential amino acids and be associated with significant structural or functional alterations in the protein. In contrast, many common SNPs have small or neutral biological effect sizes. They usually work together across many genes in a probabilistic way (Figure 3). (3)
Fig. 3
Conceptual diagram of the structural and functional organization of DNA and genes
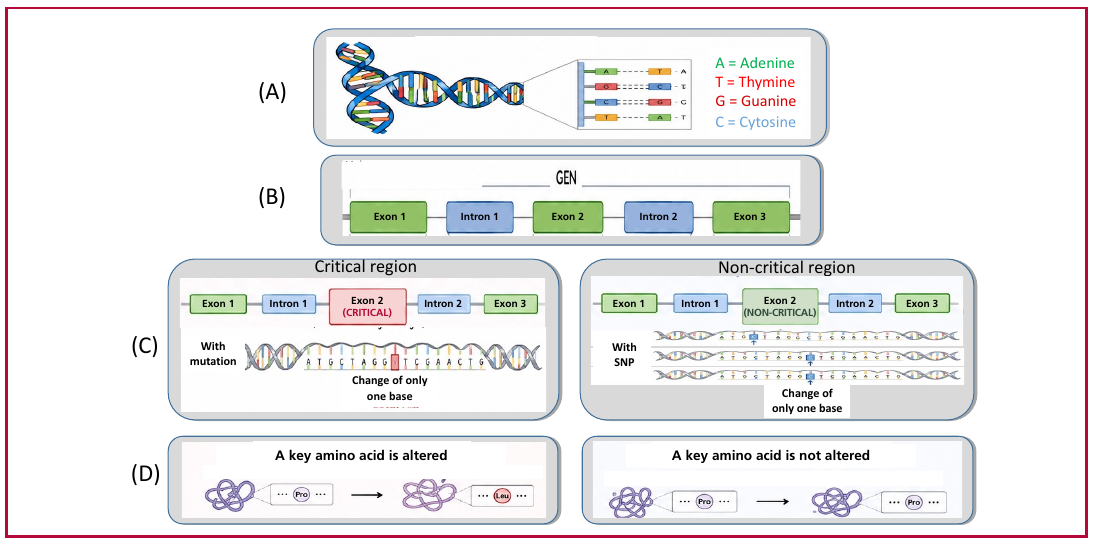
(A) DNA double-helix structure and nitrogenous base pairing: adenine (A), thymine (T), guanine (G), and cytosine (C).
(B) Schematic representation of a gene, the functional unit of DNA, composed of exons and introns.
(C) Left: Example of a single-base substitution in a critical functional region of a single gene, capable of altering a key amino acid and modifying protein structure or function.
(C) Right: Conceptual example of SNPs located in regions of lower functional impact and distributed across different genes (three are shown as examples), which individually may not produce significant alterations in the resulting protein.
(D) Structural and functional impact depending on whether a key amino acid is affected.
As previously mentioned, the clinical manifestations of genetically based diseases do not follow a single biological model but rather a continuous spectrum of genetic architectures. Some conditions are dominated by monogenic variants with large effect sizes and high penetrance, while others depend on the cumulative interaction of multiple variants with smaller individual impacts. Lying between these two extremes are intermediate models in which various relevant genetic alterations act together to shape the phenotype.
This heterogeneity helps explain the differences observed in age of onset, severity, progression, and organ involvement among patients with apparently similar diagnoses (Figure 4). (4)
Fig. 4
Conceptual model of genetic burden and disease threshold
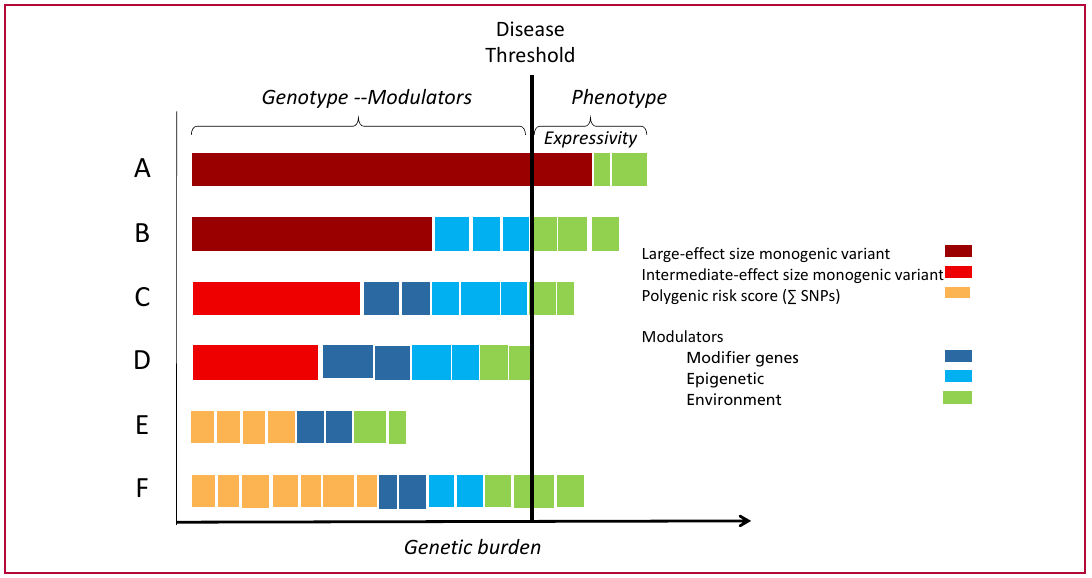
(A) Classic monogenic model, dominated by a major genetic variant with high penetrance and a large biological effect size, with little influence from genetic, epigenetic, and environmental modifiers. (B) Monogenic model, in which a major genetic variant with incomplete penetrance interacts with modifiers that determine clinical expressivity.(E and F) Polygenic model determined by the cumulative effect of numerous SNPs with small individual effect sizes distributed across different genes associated with modifiers that allow the penetrance threshold to be reached in (F), but not in (E)
(C) and (D) represent monogenic variants with intermediate effect sizes
In summary, the clinical impact of a genetic variant on diagnosis and prognosis depends on:
inheritance pattern: dominant / recessive
functional impact of the variant
critical region of the gene
type of mutation: substitution, deletion, insertion
penetrance / expressivity: genetic, epigenetic, and environmental modifiers.
Population distribution of the genetic burden and phenotypic expression
The concept of genetic burden represents the integration of the primary variant and modifiers that influence penetrance and phenotypic expressivity; in clinical studies, it is typically an estimate derived from multiple genetic inputs rather than a single input.
For monogenic variants, the minimal overlap between genetic burden distributions in the presence and absence of the phenotype indicates strong discriminative power and high specificity. Even so, the estimated risk increases significantly only when clinical expressivity is achieved. In other words, a positive genotype with a negative phenotype is, in most cases, not a factor that by dictates intervention strategies (Figure 5).
Fig. 5
Distribution of genetic burden across monogenic and polygenic variants.
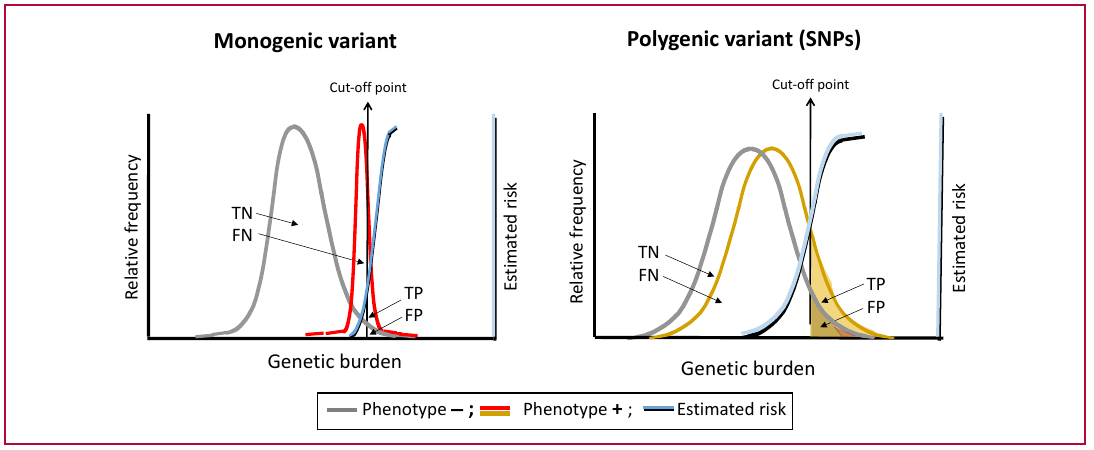
On the right, the Gaussian distribution (demonstrated for polygenic risk scores) of genetic burden is plotted in relation to a phenotypic criterion (e.g., LDL cholesterol, blood pressure, etc.) or an estimated risk (e.g., vascular event, atrial fibrillation, etc.). For comparative purposes, the theoretical distribution of high- and intermediate-penetrance monogenic variants is shown on the left.
In both panels, the distributions are schematically represented as Gaussian, based on the premise that genetic burden results from the interaction between the primary variant and multiple genetic, epigenetic, and environmental modifiers that determine penetrance and expressivity, thereby conferring the behavior of a continuous variable.
In polygenic diseases, the greater dispersion of the curve reflects the cumulative effect size of multiple small-effect size variants and their associated modifiers, while their overlap indicates a lower discriminatory capacity.
For polygenic variants, the cutoff point balances sensitivity (≈70%) and specificity (≈80%); for monogenic variants, specificity is typically high (>90%), while population-level sensitivity is lower (<25%) due to their low prevalence.
The estimated risk (represented by a sigmoidal curve derived from logistic regression) progressively increases with tge genetic burden and with the probability of exhibiting the phenotype.
TP: true positives; FP: false positives; TN: true negatives; FN: false negatives.
This figure is intended solely for conceptual purposes and does not represent exact epidemiological distributions.
The reduced sensitivity—typical of markers with low population prevalence—indicates that its absence does not rule out disease or clinical risk. Therefore, genetic information should be integrated with clinical variables for adequate diagnostic and prognostic stratification.
In contrast, polygenic variants resulting from multiple single-nucleotide polymorphisms (SNPs) typically exhibit a Gaussian distribution. Dispersion, along with discrimination between negative and positive phenotypes, is substantially lower, with wider curves and increased overlap—features associated with modifiers of penetrance (Figures 5).
Unlike monogenic variants, polygenic variants allow for selecting a cutoff point with balanced specificity and sensitivity. In this case as well, the risk increases significantly with a positive phenotype, although the slope is less steep (Figure 5). (5)
Genetic prediction of subclinical and clinical phenotypes
In diagnostic and prognostic trials, the genetic variant—either on its own or integrated with acquired risk factors—is the predictor variable, and the subclinical or clinical phenotype is the estimated risk. In other words, the genotype constitutes the input or independent variable of the model, while the phenotype represents the output or dependent variable.
Figure 6 details various phenotypes used as outputs in clinical studies of predictive genetics in cardiology. Subclinical phenotypes can be analyzed as continuous or dichotomous variables, while clinical phenotypes are typically expressed as discrete variables corresponding to diseases or complications. (2-6)
Fig. 6
Subclinical and clinical phenotypes as outputs of genetic prediction
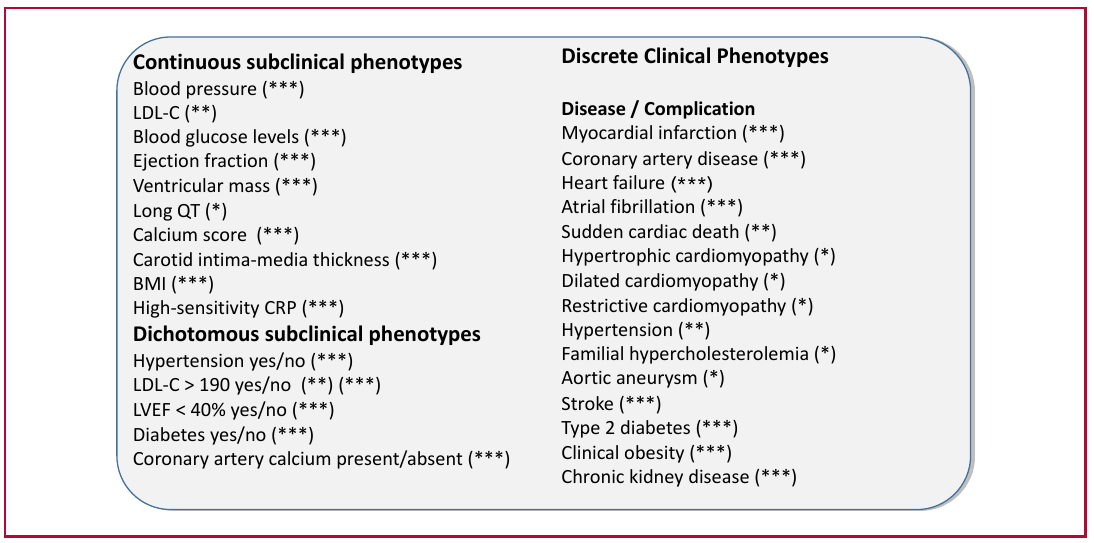
LVEF: left ventricular ejection fraction; HTN: hypertension; BMI: body mass index; LDL-C: low-density lipoprotein colesterol; CRP: C-reactive protein The phenotypes explored in clinical trials are detailed below.
Subclinical phenotypes can be analyzed as continuous or dichotomous variables, while clinical phenotypes are typically expressed as discrete variables corresponding to diseases or their complications.
The magnitude of the relative genetic contribution across different genotypes is indicated as follows: * large-effect size monogenic; ** monogenic and polygenic; *** polygenic.
Simple association, prognostic performance, and artificial intelligence
Associations between genetic variants and phenotypes, as reported by referall centers, do not necessarily imply prognostic utility in the general population. In general, these types of studies constitute an initial step that provides insight into the prevalence or incidence of one or more mutations. Clinical applicability requires subsequent evaluation of the actual predictive ability through prospective cohorts and longitudinal follow-up (Figure 7).
Fig. 7
Simple association versus genetic prognostic performance
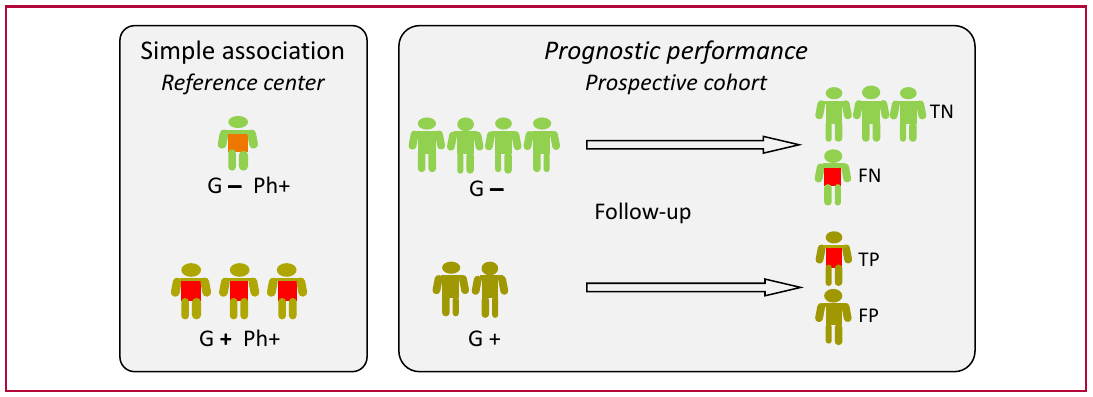
Left: The association between genetic variant (G+) and phenotype (F+) in referral centers reflects case enrichment resulting from selective referral, but without estimating predictive capacity
Right: In prospective cohorts, clinical follow-up allows for the estimation of true positives (TP), true negatives (TN), false positives (FP), and false negatives (FN), thereby enabling an evaluation of prognostic performance of the genetic variant.
From a clinical perspective, prognostic performance studies determine whether a genetic marker adequately identifies individuals who will develop the disease by estimating sensitivity, specificity, and positive and negative predictive values. This step is essential before incorporating genetic variants into risk prediction models or individual clinical decisions. (7)
Artificial intelligence enables the simultaneous integration of large volumes of genetic, biological, and clinical information, overcoming the limitations of conventional statistical models based on only a few variables (Figure 8).
Fig. 8
Conceptual diagram of an artificial intelligence model applied to clinical prediction
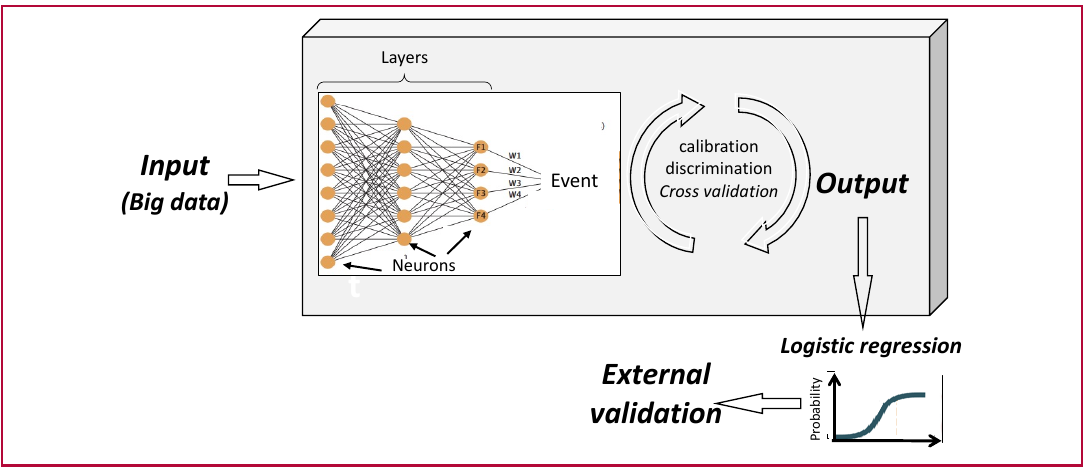
Multiple possible input variables are processed through interconnected layers of an artificial neural network. Each layer is represented by yellow dots, each of which represents a “neuron.” Starting with approximately one million SNPs (typical range 500 000- 2 000 000) as input covariates, the AI model generates multiple regression equations in each neuron that are fitted to predict the event. In the first layers (for example, 100 equations constructed from approximately 1 million covariates each [F1 x W1) ; F2 x W2 ; F1 million x W1 million], where F is the SNP and W is the assigned weight). In successive layers, the information is progressively reduced until a few latent variables are obtained in the final stage (for example, 20: [F1 × W1]; F2 × W2; F20 × W20]). Integrating these functions generates a continuous score that is subsequently transformed into an estimated probability of the event or disease (output).
During this process, the model’s predictive performance is assessed through internal validation, calibration, and discrimination, to reduce errors arising from multiple comparisons and improving the model’s generalizability. Final clinical applicability also requires external validation to generalize its conclusions.
However, as complexity increases, the risk of spurious associations and overfitting rises, particularly due to the high number of simultaneous comparisons.
For this reason, the clinical utility of a model depends not only on its predictive ability but also on adequate calibration, discrimination and methodological validation during training in artificial intelligence.
External validation is also a fundamental requirement before applying these models in clinical practice to correct potential errors resulting from multiple comparisons, but above all, to ensure reproducibility and generalizability across different populations. (8)
Conclusions
Genetic variants are often thought of as dichotomous variables (presence/absence), but this concept fails to capture the complexity of translating genetic information into clinical practice. Genetic burden is a theoretical concept that integrates multiple factors: inheritance pattern (dominant/recessive), functional impact of the variant (critical or non-critical region of the gene), and penetrance (complete/incomplete), all of which are influenced by genetic, epigenetic, and environmental modifiers.
Environmental modifiers may not be within the strict concept of genetic burden and are instead considered additional factors that improve the predictive capacity of clinical models.
Genetic variables basically include two major groups:
monogenic variables with large or intermediate effect size (prevalence <1%), with a Mendelian pattern of transmission.
polygenic variables (PRS, acronym for polygenic risk score), defined as the sum of multiple SNPs (prevalence >1%).
In monogenic diseases with a polygenic background, the inclusion of SNPs improves risk estimation.
As with any biological marker, the genetic burden for diagnostic or prognostic purposes must be interpreted with the general guidelines for evaluating biological tests.
In polygenic scores, sensitivity, specificity, positive predictive value, and negative predictive value are the parameters used to determine the clinical utility of genetic testing. In general, genetic information is integrated with conventional clinical scores.
In subjects with a positive genotype, the phenotypic expression significantly increases the probability of disease. Conversely, an isolated negative phenotype has limited value, a critical consideration in translating genetic information into medical decision-making.
Artificial intelligence expands and facilitates the analysis of large volumes of genetic information; however, its interpretive foundations remain based on the classical principles of statistics and probability.
Big data analysis significantly increases the risk of false positives due to multiple comparisons and statistical overfitting. Therefore, external validation is essential to confirm the consistency and reproducibility of initial findings.