
INTRODUCTION
The SONQO-CALCHAQUÍ I and II Programs (years 2018 and 2022) evaluated the Quilmes native community (Colalao del Valle, Tucumán), descendants of the people who settled in that area at the end of the 15th century. (1) The inhabitants had a high rate of overweight and obesity, (2) with a prevalence of cardiovascular risk factors similar to that described in urban centers. (3) The diet was based on flour. Yet, the physical condition was acceptable. (4)
Because of the characteristics of the native communities living in the Calchaqui Valleys (scattered settlements with distinctive historical, geographic and sociocultural characteristics), the question arises whether these findings would be similar in other communities in the same location. The 2023 SONQO-CALCHAQUÍ III Program studied the native communities of Cachi (province of Salta, 2530 m above sea level); Colalao del Valle (province of Tucumán, 3500 m above sea level) and Fuerte Quemado (province of Catamarca, 1795 m above sea level). Therefore, the aim of the present study was to evaluate three native communities of the Calchaqui Valleys, which, despite having similar sociocultural characteristics, present local particularities that could influence the variables studied.
METHODS
We conducted a cross-sectional descriptive study carried out on volunteers ≥ 18 years who attended the SONQO-CALCHAQUÍ III Program in Cachi, Colalao del Valle and Fuerte Quemado from September 23 to October 1, 2023. In order to evaluate only the native population, we worked together with the community delegate. The following determinations were carried out in offices implemented in the local schools:
Office 1 (Surveys):
- Targeted cardiovascular survey. (3,4)
- Mini-Mental State Examination, that evaluates cognitive impairment. (5)
- 24-hour dietary recall (6)
- Food frequency questionnaire: semi-quantitative questionnaire that includes 19 food items indicating the frequency of consumption (daily, weekly or monthly) in the last year.
-12-Item Short Form Survey (SF-12): assesses self-perceived health status on a scale of 0 to 48. (7)
- 10-item Rosenberg Self-Esteem Scale on a scale of 0 to 40. (8)
- Pittsburgh Sleep Quality Index. (9)
- Frailty test (Edmonton Scale). (10)
Office 2 (Anthropometry, blood pressure and pulse oximetry):
Body mass index (BMI), expressed in kg/m2, was calculated and values ≥18,5 and < 25 were considered normal. Waist circumference (normal ≤ 88 cm in women and ≤ 102 cm in men) and neck circumference (normal ≤ 43 cm) were measured.
Blood pressure (BP) was measured with an automatic BP monitor (Omron ® 7120) according to the guidelines of the Argentine Consensus on Hypertension. (11)
Oxygen saturation (%) and heart rate (bpm) were measured by plethysmography using a pulse oximeter (Contec® CMS50N).
Office 3 (Electrocardiogram):
12-lead electrocardiogram with a digital machine (Jotatec® TaurusTouch).
Office 4 (Echocardiography):
The dimensions (mm) and areas (cm2) of the cardiac structures (Esaote® MyLab 30 Gold) were recorded, and the left ventricular ejection fraction (LVEF) was calculated using the Simpson biplane method. (12)
Office 5 (Peripheral vascular ultrasound):
The neck vessels were evaluated using Doppler ultrasound (Esaote® MyLab 30 Gold).
Office 6 (Endurance and muscular strength testing):
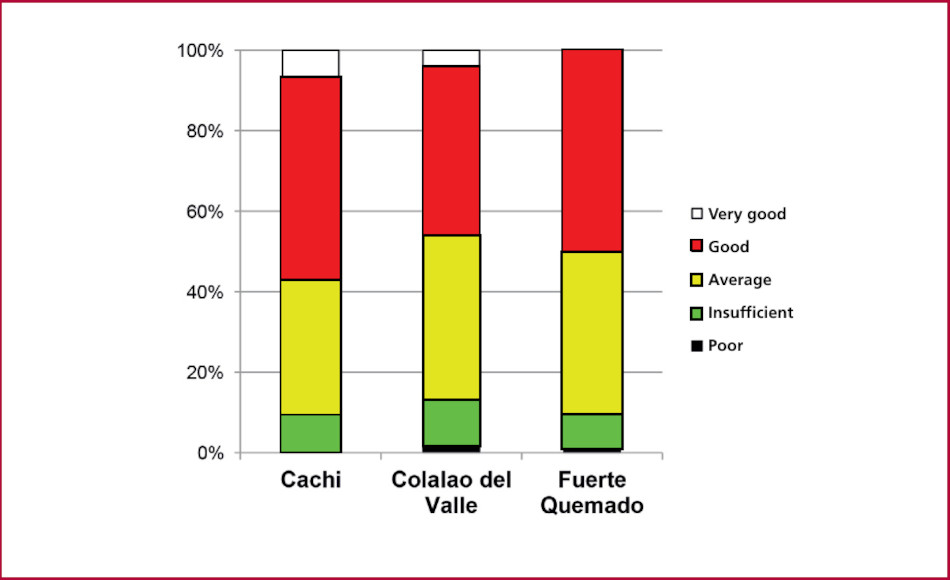
The Ruffier-Dickson test was used to assess endurance to physical stress. (13). The Ruffier index was calculated as the sum of resting heart rate plus exercise heart rate plus post-exercise heart rate minus 200 and divided by 10. The following scale was considered: 0: very good; 0.1 to 5: good; 5.1 to 10: average; 10.1 to 15: insufficient and 15.1 to 20: poor.
The maximum hand grip strength was measured by means of a hydraulic dynamometer (Jamar®) in the dominant hand and was calculated as the average of 3 trials. The normal values considered were ≥ 27 kg and ≥16 kg in women. (14)
Exclusion criteria: people with sensory, cognitive or motor disabilities.
Statistical analysis
The results were expressed as mean ± standard error. Nominal variables were analyzed using the chi-square (χ2) test (2) or Monte Carlo simulation (when data was 0). The Student's t-test was used for pooled data and ANOVA for numerical variables. A p value <0.05 was considered statistically significant. All the statistical calculations were performed using Prism 5.0.2 software package.
Ethical considerations
The study was approved by the Research Ethics Committee of the SI.PRO.SA Research Department (Decision 34/2022). All patients gave their informed consent before participating in the study.
RESULTS
Of the 880 inhabitants who participated in the SONQO-CALCHAQUÍ 2023 Program, 819 were included in this study (Cachi: 292, Colalao del Valle: 251, and Fuerte Quemado: 276); 510 were women and 309 were men. There were no differences in the distribution by sex in the communities. Mean age was 52.9±0.6 years (Cachi: 53.3±1.0 years, Colalao del Valle: 51.6±1.1 years and Fuerte Quemado: 53.7±1.0 years; p = 0.392).
Office 1
Socioeconomic and educational data:
Illiteracy was found in 11.5% of the population; 43.3% had completed primary education, 29.7% had secondary education, 10.4% had tertiary education and 2.6% were university graduates. A total of 3.1% participants did not answer this question. A different distribution was found in the three communities, with a lower proportion of illiteracy and more university students in Colalao del Valle (p = 0.041).
Occupation: 23.1% were housewives, 12.4% were unemployed, 41.5% were active workers and 14.0% were retired. A total of 4.0% participants did not answer this question. There were no differences between the three communities.
Medical coverage: 36.8% had no coverage, 32.4% had social security, 22.1% had PAMI (a medical retirement plan) and 5.6% had prepaid medical insurance. A total of 2.7% participants did not answer this question. There were no differences between the three communities.
Mobile telephone: 52.4% did not own a mobile telephone (42.5% in Cachi; 63.7% in Colalao del Valle and 52.5% in Fuerte Quemado; p<0.001). All the participants answered this question.
Targeted cardiovascular survey:
The distribution of self-reported cardiovascular risk factors is shown in Table 1. Approximately 30% of patients had not had their blood pressure checked, while more than 60% and more than 75% had not had their blood sugar and cholesterol levels measured, respectively, in the past year. Of the 258 inhabitants with hypertension, 26.0% were not receiving pharmacological treatment (52.0% in Cachi. 12.3% in Colalao del Valle and 17.6% in Fuerte Quemado; p < 0.001).
The 95 smokers smoked 5.6 ± 0.8 cigarettes per day (with no differences between the three communities).
Of the 126 inhabitants with known diabetes, 27.8% were not receiving pharmacological treatment (13.3% in Cachi, 56.0% in Colalao del Valle and 42.3% in Fuerte Quemado; p < 0.001).
Of the 72 inhabitants with known dyslipidemia, only three were receiving pharmacological treatment.
Tabla 1
Targeted cardiovascular survey
| Cachi (n=292) | Colalao del Valle (n=251) | Fuerte Quemado (n=276) | Total (n=819) | p | ||
|---|---|---|---|---|---|---|
| Did you check your BP in the last year? | YES | 71.2% | 74.9% | 61.2% | 69.0% | 0.002 |
| Do you have HTN? | YES | 25.7% | 32.3% | 37.0% | 31.5% | 0.025 |
| NO | 59.2% | 54.2% | 46.4% | 53.4% | ||
| IDK | 15.1% | 13.5% | 16.7% | 15.1% | ||
| Do you smoke? | YES | 11.6% | 11.2% | 12.0% | 11.6% | <0.001 |
| NO | 84.6% | 76.1% | 79.0% | 80.1% | ||
| FORMER | 3.8% | 12.7% | 9.1% | 8.3% | ||
| SMOKER | ||||||
| Did you check your blood sugar levels in the last year? | YES | 25.7% | 47.0% | 40.6% | 37.2% | <0.001 |
| Do you have diabetes? | YES | 25.7% | 10.0% | 9.4% | 15.4% | <0.001 |
| NO | 63.0% | 88.4% | 87.3% | 79.0% | ||
| IDK | 11.3% | 1.6% | 3.3% | 5.6% | ||
| Did you check your cholesterol in the last year? | YES | 30.8% | 25.9% | 13.4% | 23.4% | <0.001 |
| Do you have dyslipidemia? | YES | 24.3% | 0.4% | 0.0% | 5.6% | <0.001 |
| NO | 15.8% | 0.0% | 0.0% | 8.8% | ||
| IDK | 59.9% | 99.6% | 100% | 85.6% | ||
| Did you suffer a MI? | YES | 13.4% | 2.8% | 3.3% | 6.7% | <0.001 |
| NO | 79.8% | 88.0% | 85.9% | 84.4% | ||
| IDK | 6.8% | 9.2% | 10.9% | 8.9% | ||
| Did you suffer a stroke? | YES | 20.2% | 2.8% | 5.1% | 9.8% | <0.001 |
| NO | 76.4% | 92.4% | 87.3% | 85.0% | ||
| IDK | 3.4% | 4.8% | 7.6% | 5.3% |
BP: blood pressure; HTN: hypertension; IDK: I don't know; MI: myocardial infarction
In the case of only “yes” or “no” questions, only the affirmative answer is presented. When there was also the option “I don't know” the data of the three possible answers are presented
Mini-Mental State Examination
The average score was 15.0 ± 0.1 points (with no differences in this item in the three communities), indicating a population with mild to moderate cognitive impairment.
Diet
a) 24-hour dietary recall:
Breakfast: 49.0% drank yerba mate and 36.5% another infusion; 63.1% of them also ate (mainly homemade) bakery and 7.6% did not have breakfast (4.5% in Cachi, 8.8% in Colalao del Valle and 9.8% in Fuerte Quemado; p = 0.038).
Snack: 7.9% drank water alone, 8.5% drank water with other foods (mainly seasonal fruits) and 44.9% ate other foods; 38.6% did not eat snacks (30.8% in Cachi, 41.4% in Colalao del Valle and 44.2% in Fuerte Quemado; p= 0.002).
Lunch: 21.2% ate some kind of stew, 13.6% ate meat, 7.9% chicken, 14.9% pasta, 21.0% rice and 13.6% ate some other kind of food; 12.9% of respondents had consumed a dessert (usually seasonal fruit) and 7.8% did not have lunch (without differences between the three communities).
Afternoon snack: 44.4% drank yerba mate and 38.0% had another infusion accompanied by (mainly homemade) bakery in 57.9% of the respondents; 17.6% did not eat an afternoon snack (15.4% in Cachi, 23.9% in Colalao del Valle and 14.1% in Fuerte Quemado; p = 0.006); 10.6% ate something between the afternoon snack and dinner (19.5% in Cachi, 6.0% in Colalao del Valle and 5.4% in Fuerte Quemado; p < 0.001).
Dinner: 52.9% had dinner, generally the same meal as lunch (Cachi: 63.7%, Colalao del Valle: 43.8% and Fuerte Quemado: 48.9%; p < 0.001).
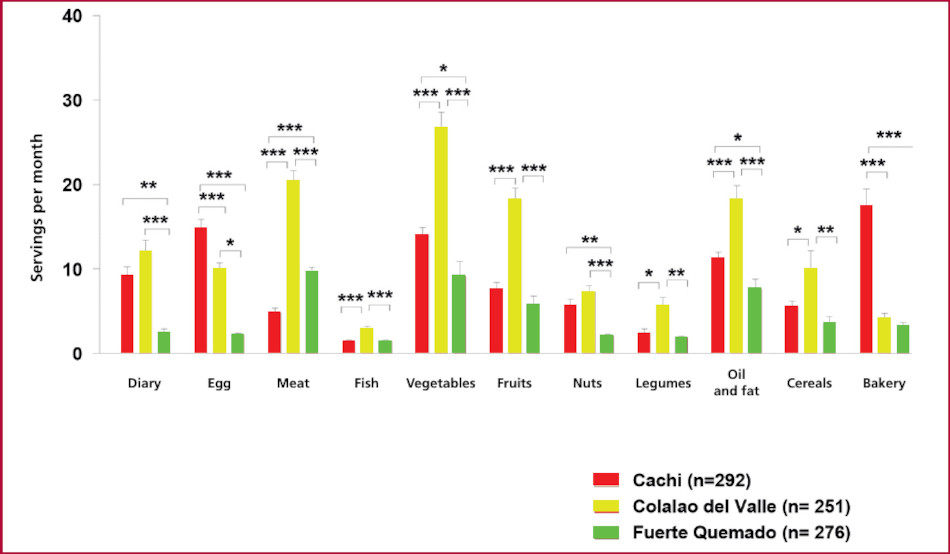
b) Food frequency questionnaire: the main results in the three communities are shown in Figure 1. There was higher consumption of meat, vegetables and fruits in Colalao del Valle and of bakery products in Cachi. The number of sugar and water servings per month was similar in the three communities (Cachi: 36.6 ± 7.1, Colalao del Valle: 36.5 ± 2.7 and Fuerte Quemado: 31.4 ± 3.2 and Cachi: 106.9 ± 5.1, Colalao del Valle: 106.5 ± 4.7 and Fuerte Quemado: 110.2 ± 4.8, respectively).
Quality of life, self-esteem, sleep quality, and frailty questionnaires
a) SF-12: mean score was 35.6 ± 0.2 points (Cachi: 36.0 ± 0.4 points, Colalao del Valle: 36.3 ± 0.4 and Fuerte Quemado: 34.5 ± 0.4; p = 0.003).
b) Rosemberg Self-Esteem Scale: mean score was 28.9 ± 0.2 points (Cachi: 28.5 ± 0.2 points, Colalao del Valle: 28.5 ± 0.2 and Fuerte Quemado: 29.8 ± 0.3; p = 0.003).
c) Sleep assessment: sleep quality was rated very good in 23.1%, fairly good in 55.8%, fairly bad in 16.9% and very bad in 4.2%. There were no differences between the three communities. 20.3% took medicine to sleep at least once in the last month (Cachi: 29.8%, Colalao del Valle: 11.2% and Fuerte Quemado: 18.5%; p < 0.001). A total of 45.3% reported drowsiness at some time during daily activities (Cachi: 36.0%, Colalao del Valle: 46.2% and Fuerte Quemado: 54.3%; p < 0.001).
d) Frailty test (Edmonton Scale): the value obtained was 3.6 ± 0.1 points (range considered as non-frail). There were no differences between the three communities.
Office 2
Mean BMI was 28.3±0.3 kg/m2 (overweight). Of the population, 0.8% was undernourished, 31.6% had adequate weight, 39.5% were overweight and 28.1% were obese, with no differences between the three communities. The mean waist circumference was 98.5 ± 0.7 cm (Cachi: 96.5 ± 0.9 cm, Colalao del Valle: 97.3 ± 0.9 and Fuerte Quemado: 100.9 ± 1.3; p = 0.014). Waist circumference was within normal ranges in 38.9% of the population, with no differences between the three communities. Neck circumference was also not significantly different, with a mean value of 38.6 ± 0.5 cm, normal in 82.9% of the inhabitants (Cachi: 78.1%, Colalao del Valle: 89.9% and Fuerte Quemado: 79.9%; p = 0.022).
Systolic blood pressure was 128.9 ± 0.9 mm Hg (26.6% presented elevated values), diastolic blood pressure was 77.2 ± 1.4 mm Hg (11.0% with elevated values), and heart rate was 71.0 ± 0.5 beats per min. There were no differences in these parameters between the three communities. Oxygen saturation was 95.4 ± 0.1% (Cachi: 94.4 ± 0.5%, Colalao del Valle: 95.8 ± 0.2% and Fuerte Quemado: 96.1 ± 0.2%; p = 0.004).
Office 3
The ECG was abnormal in 26 subjects (two had atrial fibrillation; nine had right bundle branch block and two had left bundle branch block).
Office 4
The echocardiogram was abnormal in 15.8% of the inhabitants (Cachi: 20.5%, Colalao del Valle: 13.9% and Fuerte Quemado: 12.3%; p = 0.017). These abnormalities included two cases of congenital heart disease, six of valvular calcifications, two cases of valvular stenosis, seven of valvular regurgitation and one case of pericardial effusion.
Office 5
No aneurysms, tumors or vascular malformations were found. Atherosclerotic plaques were detected in 9.5% of the inhabitants, with no significant differences between the three communities.
Office 6
The Ruffier-Dickson test was performed on 596 subjects. Resting heart rate was 71.5 ± 0.5 bpm, increased to 101.3 ± 0.7 bpm during exercise (43.1 ± 0.9% increase; p < 0.001) and decreased to 78.8 ± 0.6 bpm post-exercise (a 21.8 ± 0.4% decrease; p < 0.001). The inhabitants of the community of Colalao del Valle presented greater increase and lesser decrease in heart rate. The number of squats performed was 24.1 ± 0.3 (without significant differences).
The Ruffier index was 5.2 ± 0.1. Mean Ruffier index (Cachi: 4.9 ± 0.2, Colalao del Valle: 5.8 ± 0.3 and Fuerte Quemado: 5.1 ± 0.3; p = 0.038) and its distribution (Figure 2) were different between the three communities.
Hand grip strength was evaluated in 667 inhabitants using a dynamometer. The mean value was 25.2 ± 0.6 kg (Cachi: 22.8 ± 0.9 kg, Colalao del Valle: 28.7 ± 1.2 and Fuerte Quemado: 24.8 ± 1.1; p = 0.002). Hand grip strength was reduced in 39.1% of the inhabitants, with no significant differences.
It should be noted that 14 patients were referred to a more complex care center as a result of the results obtained.
DISCUSSION
In this new phase of the SONQO-CALCHAQUÍ Program we were able to compare some parameters related to cardiovascular health in the inhabitants of three native communities of the Calchaqui Valleys.
There were differences in the variables under study in the three communities. Colalao del Valle inhabitants have better health status because their educational level is higher, patients with hypertension and diabetes are better treated and a higher percentage of the population has normal neck circumference. However, residents of Fuerte Quemado have better sleep quality and self-esteem. These differences indicate that the inhabitants of the Calchaqui Valleys are not a homogeneous population, but that each community has its own characteristics. Follow-up studies should be conducted to assess the future impact of these different characteristics on cardiovascular health.
According to the records reviewed, the sample represents 4.4% of the total population of Cachi and 11.1% of the total population of Colalao del Valle. 15 Fuerte Quemado lacks recent statistics, so this data could not be calculated. Interestingly, the records reviewed do not differentiate between native and non-native inhabitants, so it can be assumed that the sample recorded in this study is representative of the native communities studied.
Although the three communities have some different features, they share similar characteristics in terms of non-frail populations with good self-esteem, good sleep quality, and mild to moderate cognitive impairment.
It is worth noting that the average BMI was in the overweight range and that 67.6% of the population was overweight. One bias of the present study may be the lack of sampling, as the population evaluated consisted of individuals who voluntarily agreed to participate. However, this finding was already observed in previous editions of the SONQO-Calchaquí Program 2,4 and has been reported by other authors. 16 In addition, high levels of overweight have been reported in other native populations in Argentina, such as the Wichi 17 and Toba communities. 18 A recent study showed that the inhabitants of Northwest Argentina have a high rate of overweight and obesity. 19 The high BMI may be due to dietary changes. In the present study, the 24-hour dietary recall questionnaire showed low intake of fruits, nuts, and legumes. To underscore this point, the 24-hour recall indicates a diet based on stew, rice and pasta, with low intake of dairy products. Archaeological studies indicate that the diet of the Calchaqui Valleys has been based on carbohydrates since prehistoric times. 20 This difficult access to food has persisted to the present day, with the difference that the access to processed food is increasing. The low consumption of nuts (which have proven cardiovascular benefits) 21 is particularly noteworthy, given that this area is a producer of nuts. Several factors are likely to be involved in the poor choice of food, especially economic factors: 22 more than half of the population is not employed and does not have tertiary education. This is coupled with the difficult access observed in this geographical area since prehistoric times, 20 as well as the difficulty of storage and social factors. This poor dietary choice should be further investigated as it has a direct impact on the cardiovascular health of the population. It is noteworthy that the low consumption of ultra-processed food and the high consumption of yerba mate suggest that the process of westernization is not yet complete.
Regarding economic factors, it has been shown in other populations that people of low socioeconomic status have low protein diets, mainly due to the higher cost of healthy food. 23,24
The decreased hand grip strength found in 39.1% of the population could indicate sarcopenia. However, the Ruffier index was found to be within the average to good range, with a limited number of subjects in the insufficient range, indicating adequate cardiac endurance during exercise. 25 In this regard, it is important to consider the potential protective role that their lifestyle and socioeconomic status may play in other health domains (sleep quality and self-esteem). It can be hypothesized that deep-rooted traditions, coupled with a social background that accompanies and gives identity to the person, together with a rough terrain which implies greater physical activity, would be important factors in this protective role. In this sense, further studies are needed to validate this hypothesis.
The absence of atherosclerotic lesions in most of the population studied (only 9.5% of the population had plaques on neck vessel Doppler ultrasound) would support the existence of local factors with a cardiovascular protective role. In other populations, it is difficult to find patients with elevated BMI without atherosclerotic plaques. Whether this protection is genetic or epigenetic remains to be determined in future studies.
In conclusion, the inhabitants of the Calchaqui Valleys are not a homogeneous population, and each community has its own characteristics. In general, their physical fitness is acceptable, but the rate of overweight and obesity is high, regardless of the community in which they live, indicating a Western diet pattern. There are, however, local factors with a protective role in cardiovascular disease that should be further investigated in this population.
Conflicts of interest
None declared. (See authors' conflict of interests forms on the web).
Financing
See the Acknowledgment section.
Acknowledgments
The authors would like to thank the following people and entities, without whose valuable collaboration the SONQO-CALCHAQUÍ Program would not have been possible:
-
Digimed Ultrasonido (Buenos Aires)
-
Faculty of Medicine - National University of Tucumán
-
Farmacia Del Pueblo (Tucumán)
-
Grupo GEPE and Mr. Eduardo Luis Avellaneda
-
Honorable Legislatura de Tucumán
-
Laboratorio Baliarda S.A.
-
Laboratorio Cassará
-
Laboratorio Lepetit
-
Ministry of Health, province of Catamarca
-
Ministry of Health, province of Tucumán
-
Ministry of Public Health, province of Salta
-
NGO La Chata Solidaria
-
Argentine Society of Cardiology
-
Mr. Américo Liendro (Major of Cachi - Salta)
-
Mr. Gustavo Morales (Community delegate of Colalao del Valle - Tucumán)
-
Mrs. Erica Inga (Major of Santa María - Catamarca)