

INTRODUCTION
Early detection of subclinical cardiac target organ damage (TOD) is essential for the stratification of the overall cardiovascular risk in hypertensive patients and has a direct impact on the appropriateness of treatment, the target blood pressure (BP) value and the time to achieve it, as well as the choice of the drug class expected to provide the greatest therapeutic benefit. (1, 2)
Normalization of cardiac chambers measurements using allometric height-based indexing (AHI) improves the detection of TOD in subjects with hypertension (HT) and overweight or obesity compared to body surface area-based indexing (BSAI). Although this has been included in international guidelines, (3, 4, 5, 6, 7, 8) its use in clinical practice is not widespread. This may be due to different factors, including lack of knowledge, habit or technical difficulties because of the lack of suitable calculation packages for this population in most echocardiography equipment.
Both HT and obesity promote left ventricular remodelling and hypertrophy (LVH) independently and synergistically. (9, 10, 11, 12) Increased ventricular mass in non-hypertensive subjects is related to weight and body mass index (BMI), (13, 14) and the presence of obesity-related LVH is an independent predictor of cardiovascular events. (15) Likewise, obesity per se may promote atrial chamber enlargement. In a subanalysis of the MONICA/KORA study, obesity was the most important independent predictor of the incidence of left atrial enlargement (LAE) after aging. (16)
In view of today’s obesity pandemic, which in some regions has reached a prevalence of almost 60% in populations over 20 years old, (17) and in which 75% of the incidence of HT is directly related to overweight, (18) we wondered how often the use of AHI, compared to BSAI leads to the reclassification of subjects in terms of the presence of TOD according to their degree of obesity. This knowledge is important to measure the degree of error that results from failing to use the appropriate indices.
OBJECTIVES
To compare the prevalence of TOD, defined as LVH and/or LAE, according to the echocardiographic indexing method used, and to estimate the level of agreement between the methods and the percentage of subjects who are reclassified according to their degree of obesity.
METHODS
Between January 2020 and December 2021, adults over 18 years old with a diagnosis of HT either under drug treatment or non-drug treatment and referred to a Doppler echocardiography were prospectively assessed. Subjects with any other cardiovascular history or relevant comorbidity were excluded, except for cardiovascular risk factors, known secondary HT, pregnancy, echocardiographic findings consistent with significant valvular heart disease, structural heart disease of other origin or systolic dysfunction. A complete medical history was taken from all patients and weight, height (H) and BP were recorded. Body surface area (BSA) was estimated using the Du Bois and Du Bois formula: BSA (m2) = 0.007184 x H (cm)0.725 x weight (kg)0.42. BMI was calculated according to the formula: BMI (kg/m2 ) = Weight (kg) / [H (m)]2. BP was measured in a seated position, after a 5-minute rest, with an automatic sphygmomanometer (Omron MODEL Hem 7142, Omron Corporation). Two consecutive measurements were obtained, with an interval of 2 minutes between each one, and the values were averaged. Controlled BP at the time of the study was defined as the presence of systolic BP <140 mmHg and diastolic BP <90 mmHg. Doppler echocardiography was performed immediately after BP measurement.
Echocardiography
A Mindray M9 equipment with SP5-1s probe was used. Cardiac chambers diameters and remodelling patterns were evaluated according to the recommendations of the American Society of Echocardiography Guidelines. (3, 4) M-mode was used to measure left ventricular (LV) diameters. LV ejection fraction (LVEF) was estimated using the biplane Simpson method. Left ventricular mass (LVM) was calculated with the Devereux formula and indexed to BSA and H2,7. Relative wall thickness (RWT) was calculated with the formula 2 x LV posterior wall thickness in diastole/LV end-diastolic diameter (LVEDD), and a value ≥ 0.42 was considered increased RWT. Left atrial (LA) volumes were assessed by using the modified biplane Simpson's method from apical 2- and 4-chamber views. In each case, 2 measurements were obtained and averaged. Absolute values were indexed to BSA and H2. Table 1 shows the cut-off values used for each determination. The choice of these allometric indices over others was based on the evidence supporting their use and the recommendations of international guidelines. (5, 6, 7, 8)
TABLE 1
Cut-off limits used in indexed echocardiographic measurements.
| Variable | Men | Women | Reference |
|---|---|---|---|
| LVM/BSA (g /m2) | ≤ 115 | ≤ 95 | 3, 4 |
| LVM/H2.7 (g/m2.7) | ≤ 50 | ≤ 47 | 5-8 |
| LAV/ BSA (mL/m2) | ≤ 34 | ≤ 34 | 5-8 |
| LAV/H2 (mL/m2) | ≤ 18.5 | ≤ 16.5 | 5-8 |
BSA: body surface area; H: height; LAV: maximum left atrial volume; LVM: left ventricular mass
Statistical analysis
Qualitative variables are presented as absolute frequency and percentage, and quantitative variables are presented as median and interquartile range (IQR 25-75) or mean and standard deviation (SD), according to data distribution. The distribution of variables was analysed in the total population and by BMI subgroups (<25, 25-29.9, 30-34.9, ≥35 kg/m2). Comparison of discrete variables was performed with the chi-square test with Fisher’s correction. Comparison of continuous variables was performed with Kruskal-Wallis or ANOVA method, as appropriate. Comparison of the prevalence of LVH/LAE/TOD between both methods was performed with the paired binomial test. The degree of agreement for the classification of presence/absence of subclinical cardiac TOD between different indexing methods was evaluated with Cohen's Kappa index (k), considering that a value of 1 represents perfect agreement in the classification of each case and a value of 0 indicates agreement no better than that expected by chance. A statistical significance level of 0.05 (bilateral test) was used in the hypothesis tests. Data processing was performed with EpiInfo version 7.2.5.0 (CDC, Atlanta) and EpiDat version 4.2 (Consellería de Sanidade, Xunta de Galicia, Spain; PAHO, Washington; Universidad CES, Colombia. Available at: http://www.sergas.es/Saude-publica/EPIDAT).
Ethical considerations
The study was evaluated by an independent Research Ethics Committee. Informed consent was obtained from participants prior to enrolment. The research was conducted in accordance with the principles of the Declaration of Helsinki.
RESULTS
A total of 150 subjects were included. Mean age was 57.1 years (SD 12.6); 62.7% were women, 58.7% were obese; 94% were receiving drug treatment. Tables 2 and 3 show the clinical and echocardiographic characteristics of the population. Non-indexed and H2,7- indexed LVM, and non-indexed or H2- indexed maximum left atrial volume (LAV) presented higher values in the groups with higher obesity, while BSA-indexed LVM and LAV showed no differences between the groups according to BMI.
TABLE 2
Clinical characteristics of the population included in the study by body mass index (BMI) categories
| Global n = 150 | <25 kg/m2 n = 21 | 25-29.9 kg/m2 n = 41 | 30-34.9 kg/m2 n = 58 | ≥35 kg/m2 n =30 | p | |
|---|---|---|---|---|---|---|
| Age (years) | 57.10 (12.66) | 60.57 (15.35) | 56.00 (11.40) | 57.84 (12.84) | 54.73 (11.88) | 0.389 |
| Women | 94 (62.67%) | 16 (76.19%) | 23 (56.10%) | 32 (55.17 %) | 23 (76.67%) | 0.097 |
| Diabetes mellitus | 39 (26.00%) | 1 (4.76%) | 9 (21.95%) | 17 (29.31%) | 12 (40.00%) | 0.034 |
| Current or past smoking | 65 (43.33%) | 7 (33.33%) | 17 (41.46%) | 24 (41.38%) | 17 (56.67%) | 0.365 |
| Dyslipidemia | 78 (52.00%) | 16 (76.19%) | 17 (41.46%) | 33 (56.90%) | 12 (40.00%) | 0.028 |
| Weight (kg) | 84.37 (16.33) | 61.23 (8.31) | 77.31 (9 .12) | 88 .87 (11.08) | 101.48 (12.88) | < 0.001 |
| Height (m) | 1.64 (0.09) | 1.63 (0.09) | 1.66 (0.09) | 1.66 (0.10) | 1.60 (0.08) | 0.039 |
| BSA (m2) | 1.90 (0.21) | 1.66 (0.16) | 1.85 (0.17) | 1.96 (0.18) | 2.01 (0.16) | < 0.001 |
| BMI (kg/m2) | 31.22 (5.62) | 22.94 (1.57) | 27.7 (1.27) | 32.3 (1.48) | 39.7 (3.20) | < 0.001 |
| Diagnosis of HT older than 1 year | 115 (76.67%) | 16 (76.19%) | 19 (70.73%) | 47 (81.03%) | 23 (76.67%) | 0.698 |
| Drug treatment | 141 (94.00%) | 19 (90.48%) | 36 (87.80%) | 57 (98.28%) | 29 (96.67%) | 0.138 |
| SBP (mmHg) | 136.14 (15.53) | 138.66 (19.80) | 135.78 (13.09) | 136.06 (14.89) | 135.00 (17.05) | 0.866 |
| DBP (mmHg) | 85.61 (9.03) | 85.38 (9.22) | 86.31 (8.69) | 85.03 (9.70) | 85.93 (8.35) | 0.912 |
| MBP (mmHg) | 102.38 (9.45) | 103.10 (10.51) | 102.77 (7.88) | 101.91 (9.97) | 102.25 (10.05) | 0.952 |
| Pulse pressure (mmHg) | 50.52 (14.39) | 53.28 (18.56) | 49.46 (14.26) | 51.03 (13.3) | 49.06 (13.67) | 0.715 |
| Controlled BP | 65 (43.33%) | 9 (42.86%) | 16 (39.02%) | 25 (43.10%) | 15 (50.00%) | 0.836 |
| HR (bpm) | 73,88 (13,31) | 72,14 (10,38) | 71,73 (12,73) | 75,08 (15,21) | 75,7 (11,98) | 0,486 |
BMI: body mass index; BP: blood pressure; BPM: beats per minute; BSA: body surface area; DBP: diastolic blood pressure; HR: heart rate; HT: hypertension; MBP: mean blood pressure; SBP: systolic blood pressure.
Quantitative variables are expressed as mean (SD) and categorical variables as absolute frequency (%).
TABLE 3
Echocardiographic characteristics of the population included in the study by body mass index categories
| Global n = 150 | < 25 kg/m2 n = 21 | 25-29.9 kg/m2 n = 41 | 30-34.9 kg/m2 n = 58 | ≥35 kg/m2 n =30 | p | |
|---|---|---|---|---|---|---|
| LVDD (cm) | 4.63 (4.34-4.99) | 4.44 (4.30-4.76) | 4.59 (4.23-4.94) | 4.64 (4.40-4.90) | 4.89 (4.50-5.57) | 0.032 |
| IVS (cm) | 1.03 (0.20) | 0.87 (0.19) | 1.05 (0.19) | 1.05 (0.20) | 1.07 (0 .18) | 0.001 |
| PW (cm) | 0.89 (0.16) | 0.77 (0.18) | 0.88 (0.16) | 0.93 (0.15) | 0.91 (0.15) | 0.001 |
| RWT | 0.38 (0.07) | 0.34 (0.07) | 0.39 (0.07) | 0.40 (0.08) | 0.37 (0.06) | 0.004 |
| LVM (gr) | 150.03 (124.22-192.02) | 115.87 (90.97-152.15) | 139.19 (129.10-177.78) | 159.23 (125.67-192.02) | 171.49 (135.33-221.08) | < 0.001 |
| LVM/ BSA (g/m2) | 78.05 (66.60-98.64) | 67.68 (58.16-84.32) | 76.71 (68.58-98.64) | 80.43 (65.68-93.30) | 80.25 (69.74-110.54) | 0.117 |
| LVM/H2.7 (g/m2.7) | 38.80 (33.04-48.47) | 29.02 (24.94-38.78) | 36.19 (32.71-44.44) | 39.38 (34.33-47.74) | 48.30 (39.08-63.71) | < 0.001 |
| LVEF (%) | 63.06 (4.47) | 62.55 (3.54) | 64.37 (4.66) | 62.04 (4.10) | 63.68 (5.10) | 0.065 |
| LAV (mL) | 47.80 (12.30) | 41.16 (11.63) | 46.40 (10.86) | 49.18 (12.49) | 51.84 (12.64) | 0.013 |
| LAV/BSA (mL/m2) | 25.28 (6.19) | 25.38 (8.15) | 25.09 (5.22) | 25.15 (6.34) | 25.74 (5.85) | 0.973 |
| LAV/H2 (mL/m2) | 17.64 (4.48) | 15.42 (4.53) | 16.65 (3.19) | 17.92 (4.64) | 20.07 (4.67) | < 0.001 |
BSA, body surface area; H, height; IVS, interventricular septum; LAV, maximum left atrial volume; LV DD, left ventricular diastolic diameter; LVEF, left ventricular ejection fraction; LVM, left ventricular mass; PW, posterior wall; RWT, relative wall thickness.
Quantitative variables are expressed as mean (SD) or median (IQR 25-75) and categorical variables as absolute frequency (%).
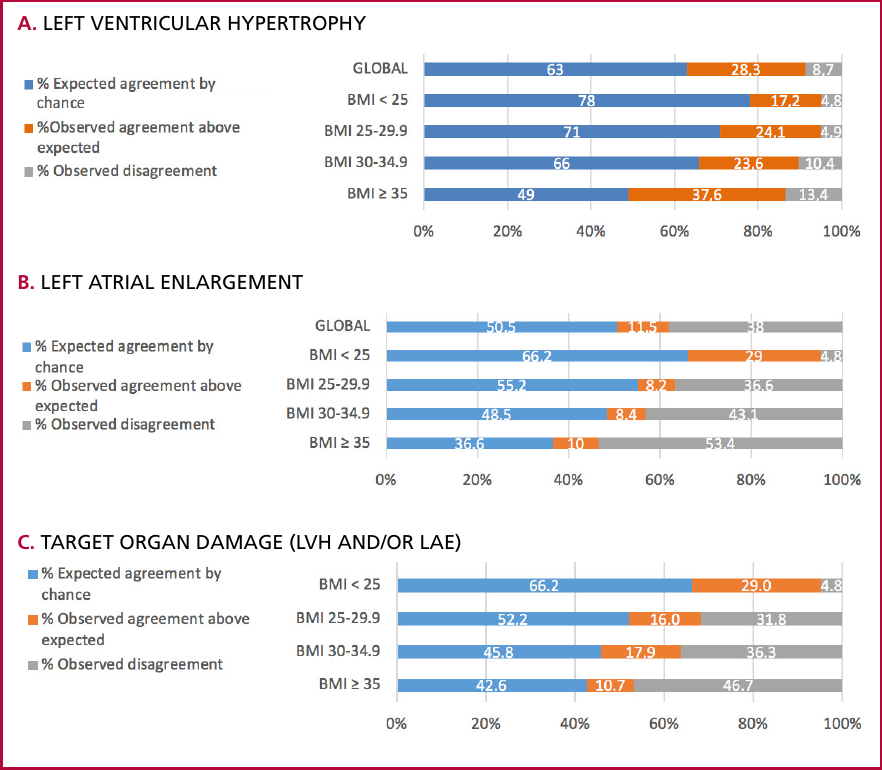
The presence of LVH ranged from 22% using BSAI to 25.3% using AHI (p= 0.266), with a greater difference between the methods at higher BMI (Figure 1). The overall agreement for classification according to the presence or absence of LVH was substantial (k= 0.76), with the highest level of agreement in the group with BMI 25-29.9 and the lowest level of agreement in the group with BMI 30-34.9 (Table 4 and Figure 2). The use of LVM indexed to H2,7, compared to BSAI, resulted in the reclassification regarding the presence of LVH in 13 subjects (8.6%).
FIGURE 1
Prevalence of left ventricular hypertrophy (A), left atrial enlargement (B) or subclinical cardiac target organ damage (C) by indexing method and body mass index category

AHI: allometric height-based indexing; BMI: body mass index; BSAI: body surface indexing; LAE: left atrial enlargement; LVH: left ventricular hypertrophy; Prev diff: difference in prevalence between indexing methods; TOD: subclinical cardiac target organ damage (LVH and/or LAE). The p value presented to the right of each row corresponds to the comparison of the prevalence observed between both methods in the paired analysis by body mass index subgroup.
TABLE 4
Level of agreement for the determination of presence or absence of subclinical cardiac target organ damage using body surface area-based indexing or allometric height-based indexing
| BSAI vs AHI measurement | BMI subgroup | Agreement | k | 95% CI | Maximum k value |
|---|---|---|---|---|---|
| LVH | Global | 913% | 0.76 | 0 .63-0.88 | 0.82 |
| <25 kg/m2 | 95.2% | 0.77 | 0.35 -1 | 090 | |
| 25-29.9 kg/m2 | 95.1% | 0.82 | 0.60-1 | 0.90 | |
| 30-34.9 kg/m2 | 89.6% | 0.68 | 0.45-0.91 | 0.79 | |
| ≥35 kg/m2 | 86.6% | 0.73 | 0.5-0.96 | 0.73 | |
| LAE | Global | 62% | 0.23 | 0.13-0.33 | 0.33 |
| <25 kg/m2 | 95.2% | 0.85 | 0.59-1 | 0.90 | |
| 25-29.9 kg/m2 | 63.4% | 0.18 | -0.006-0.37 | 0.35 | |
| 30-34.9 kg/m2 | 56.9% | 0.16 | 0.02-0.29 | 0.27 | |
| ≥35 kg/m2 | 46.6% | 0.15 | 0.005-0.30 | 0.16 | |
| TOD | Global | 67.3% | 0.38 | 0.26-0.49 | 0.40 |
| <25 kg/m2 | 95.2% | 0.85 | 0.59-1 | 0.90 | |
| 25-29.9 kg/m2 | 68.2% | 0.33 | 0.09-0.58 | 0.42 | |
| 30-34.9 kg/m2 | 63.7% | 0.33 | 0.14-0.51 | 0.35 | |
| ≥35 kg/m2 | 53.3% | 0.18 | 0.005-0.36 | 0.23 |
AHI: allometric height-based indexing; BMI: body mass index; BSAI: body surface area indexing; H: height; k: Kappa index;LAE: left atrial enlargement; LVH: left ventricular hypertrophy; TOD: subclinical cardiac target organ damage (LVH and/or LAE)
FIGURE 2
Graphical representation of the Kappa index for the determination of presence or absence of left ventricular hypertrophy (A), left atrial enlargement (B) and subclinical cardiac target organ damage (C) between body surface area-based indexing or allometric height-based indexing
BMI, body mass index; LAE, left atrial enlargement; LVH, left ventricular hypertrophy.
The greatest discrepancy between the methods was recorded in the detection of LAE, which ranged from 11.3% using BSAI to 49.3% using AHI (p < 0.001), with a greater difference in prevalence between the groups at higher BMI (Figure 1). The overall agreement between the methods for LAE detection was low (k= 0.23), with the exception of the group with BMI ≤ 25, which showed a substantial level of agreement (k= 0.85). In the rest of the groups, the level of agreement was poor and the greatest discrepancy was observed in the group with BMI ≥35 (Table 4 and Figure 2). Using AHI for LAV resulted in the reclassification of 57 subjects (38%). In all discordant cases, by using AHI, LAE was identified in subjects classified as not having LAE according to BSAI.
When comparing the prevalence of TOD (LVH and/or LAE) using either BSAI or AHI, a detection rate of 26% and 56%, respectively, was observed (p<0.001), with a greater difference between methods in the higher BMI subgroups (Figure 1). The overall level of agreement between the methods for the detection of TOD was moderate (k= 0.38); the group with BMI ≤25 showed a substantial level of agreement (k=0.85), in the remaining groups the level of agreement was low, and the greatest discrepancy was observed in the group with BMI ≥35 (Table 4 and Figure 2).
DISCUSSION
The results of this study show that the presence of subclinical cardiac TOD may remain undetected in a high proportion of overweight or obese hypertensive subjects when using BSAI instead of AHI. The level of agreement between both methods for the detection of TOD was poor, lower for the detection of LAE than LVH, and with greater discrepancies at higher BMI. In the group of subjects without overweight, the level of agreement between the two methods was high, both for the detection of LVH and LAE, which leads us to believe that in hypertensive populations with a high prevalence of overweight or obesity, such as the one included in the present study, the global use of AHI may be convenient.
Numerous studies have evaluated the impact of the indexing methods used to detect LVH, both in selected cohorts of subjects with HT and in population-based studies. The frequencies reported vary considerably depending on the characteristics of the population included and the cut-off values used to define LVH. When reviewing the studies that compared BSAI and AHI, a consistent finding was the higher detection rate of LVH using AHI, and the difference was greater when the proportion of obese subjects in the included sample was higher. (19, 20, 21, 22) Using AHI for LVM has shown to be more predictive of cardiovascular events than BSAI at follow-up in overweight or obese hypertensive subjects (19, 22, 23). Gosse et al. reported in a cohort of 763 hypertensive subjects that LVM (g/H2,7) before the initiation of treatment was the strongest predictor of cardiovascular events at follow-up, above other risk factors, such as age, systolic BP, and smoking, as well as the second strongest predictor of all-cause death, after age. Detection of LVH at follow-up had a similar predictive value, whereas regression of LVH was associated with lower cardiovascular risk. (23) In the study by Kuznetsova et al., the presence of LVH according to the H2,7 method had the highest prognostic value for fatal or non-fatal cardiovascular events compared to other indexing methods. (19) That study also evaluated the level of agreement for the detection of LVH using different indexing methods according to the degree of obesity. Similar to this study, the difference in the detection of LVH between the two methods was small in the subgroup of non-overweight, but it increased sharply in the subgroups of overweight or obese subjects, with a difference in prevalence of almost 20% in the latter group. In that study, the level of agreement for the detection of LVH between BSAI and AHI (k= 0.72) was similar to that observed in this study. In contrast to our study, the level of agreement in the subgroups for BMI was not compared in that study.
It is worth noting that the use of AHI for LVM has predictive value not only at individual level but also at population level. De Simone et al. compared the population attributable risk of LVH defined by different indexing methods in the Strong Heart Study cohort and found that normalization of LVM to H2,7 had the highest population attributable risk of cardiovascular events at follow-up, both in the total population and in the subgroup of subjects with HT. (24)
Similarly, using AHI for LAV was also shown to be superior to BSAI for the detection of LAE and prediction of events at follow-up in overweight or obese subjects. (25-27) In a sample of 127 overweight or obese subjects, of which 50% had HT, Ilijevska et al. observed that the frequency of LAE ranged from 15.7% to 70.1% depending on whether BSAI or AHI was used. AHI led to reclassification from normal LAV to enlarged LAV in 52.8% of subjects, with variations from 38.9% in the group with overweight to 88.2% in the group with BMI >40 kg/m2. (25) Similar results were reported by Airale et al. in a study that included 441 hypertensive subjects; the frequency of LAE ranged from 23.4% to 50.6% using either BSAI or AHI, with a level of agreement for the detection of LAE between the two methods of k= 0.46. (26) In the study by Davis et al. LAE detected by AHI was independently predictive of death and cardiovascular events in all BMI groups and showed an overall performance, in terms of sensitivity and specificity, superior to BSAI across all BMI categories, including the group with BMI <25 kg/m2. (27) The reclassification rate from normal to enlarged LA using AHI was 28.5% in the total sample and reached 55.4% in the group with BMI >40 kg/m2. The subgroup of reclassified subjects showed an increased risk of death and cardiovascular events across all BMI categories, including those with normal or near-normal BMI. (27)
CONCLUSIONS
Overweight and obesity are growing public health issues worldwide. In Argentina, results from the most recent Cardiovascular Risk Factor Survey showed that 61.6% of the adult population is overweight, (28) and this proportion is likely to be higher in the population with HT.
Although it has been known since the 1980s that the use of weight-related parameters, such as BSA, to index cardiac structures in overweight or obese subjects has a deficit in detecting LVH and LAE compared to AHI, BSAI is still widely used in daily practice either for reasons of tradition or simplicity.
In addition to what has already been reported in the literature, the results of this study highlight the significant discrepancy in the classification of subjects according to the presence or absence of TOD when using one indexing method or the other, which is more evident in subjects with severe obesity.
In view of the evidence provided, we must increase efforts to adapt practice to the characteristics of the population we treat. To this end, we consider it essential to include in the echocardiography equipment a calculation package appropriate to this population in order to allow the application of AHI in the parameters above mentioned, and to recommend its implementation in local clinical practice guidelines. Besides, we suggest considering the systematic use of AHI in all hypertensive subjects.
LVM and LAV indexed to BSA underestimate the presence of TOD in hypertensive overweight or obese patients, leading to an incorrect assessment of their cardiovascular risk and the therapeutic implications of this underdiagnosis. We hope this study will help to bring this issue to the forefront.
Limitations
Prevalence of LVH in our sample was lower than in other studies, probably because all subjects were on treatment and most had BP values near to normal. Reclassification of LV morphological patterns and ventricular enlargement was not evaluated due to sample size limitations. The value of the k- statistic is influenced by the prevalence of the phenomenon under study, so caution should be exercised when extrapolating the data to populations with different characteristics.
Conflicts of interest
None declared. (See authors' conflict of interests forms on the web).
Acknowledgments
We thank Bárbara Lux and María Fernanda Ramírez Serrano for their collaboration in data collection.