

INTRODUCTION
Since its introduction around 2010, high-sensitivity troponin has become the biomarker of choice to diagnose acute myocardial infarction (AMI). (1,2,3) Both troponin T and I are integral components of myocardial cells, released from necrotic tissue, and exhibit high specificity for the diagnosis of AMI. (4) High-sensitivity assays offer improved sensitivity compared to other diagnostic tests, which increases their usefulness in emergency departments. (2,3,5)
Different studies have demonstrated that both troponin T and I provide high diagnostic accuracy for AMI, little variability in terms of symptom onset and multiple sampling, as well as high predictive value. (2,3,6,7,8,9,10) Today, most medical centers have access to these tests, but2 the distribution of assays and manufacturers is heterogenous, and the centers use different cut-off points and percentiles. As a result, the collection of these values in multicenter studies has become a challenge that hinders the interpretation and correct analysis of data in acute coronary syndrome (ACS). Therefore, we propose a new system that uses the 99th percentile of the high-sensitivity troponin to standardize the different assays and assess their predictive ability.
METHODS
We performed a prespecified analysis of the patients included in ReSCAR (11), a multicenter, prospective, observational registry performed in Argentina, which included patients with ACS from several centers of the country and collected data from history, ACS characteristics and treatment, as well as hospital events and patient status at one-year follow-up. ReSCAR included 984 patients with ST-elevation ACS or non-ST-elevation ACS from 15 centers in Argentina from January to August 2022.
Generation of a new score using the 99th percentile of troponin level
We transformed the high-sensitivity troponin value at admission, both troponin T assays and troponin I assays, into multiples of its 99th percentile, generating a new score. Only values at admission were included, regardless of whether they were the highest during hospital stay. For example, in a center, if a 99th percentile of troponin is 14 and the patient had a troponin of 28, his multiplier score (MS) is 2.
Comparison
To evaluate the effectiveness of the percentile, we compared its ability to predict ischemic and bleeding events with that of the GRACE (12) and CRUSADE (13) scores, analyzing the areas under the ROC curves. In addition, we evaluated the score ability to predict in-hospital and one-year follow-up mortality, again comparing it with the GRACE score, and analyzing the ROC curve. Ischemic events were defined as AMI, stent thrombosis, stroke/transient ischemic attack (CVA/TIA) or post-infarction angina. Bleeding events were defined as those that were BARC 2 or greater. (14)
Data collection and inclusion criteria
As previously mentioned, we analyzed data from ReSCAR, an observational, cross-sectional, multicenter registry that included patients ≥18 years with ACS from several hospitals in Argentina, which had a coronary care unit, 24-hour hemodynamics service and ability to measure high-sensitivity troponin, from January to August 2022. Follow-up was carried out by telephone calls, and the information was complemented with data from medical records. Inclusion criteria were age ≥18 years, ST-elevation ACS or non-ST-elevation ACS, and a signed informed consent, whereas the only exclusion criterion was being lost to follow-up.
Data collected included history and ACS characteristics (type of ACS, Killip-Kimball scale, ECG findings), invasive or conservative strategy, time to coronary angiography (CA), treatment strategy, CA findings, ischemic, electrical and mechanical complications, requirement for mechanical ventilation and ventricular assistance, bleeding complications, in-hospital mortality and length of hospital stay.
Statistical analysis
Statistical analysis was performed with the IBM SPSS 25.0 software (for Mac iOS). Continuous variables were expressed as median and interquartile range (IQR) or mean and standard deviation, according to their distribution. Categorical variables were presented as frequencies and percentages. Normality analysis was performed using the Kolmogorov-Smirnov and Shapiro-Wilk tests.
The ROC curves were plotted using the sensitivity (true positive rate) and 1-specificity (false positive rate) of the 99th percentile of the high-sensitivity troponin for different endpoints: in-hospital ischemic events, in-hospital bleeding events, and in-hospital and one-year follow-up mortality. The area under the ROC curve (AUC ROC) was then calculated for each of these determinations, allowing the diagnostic threshold for the test to be calculated and compared with the traditional scores. Statistical significance was achieved when an alpha error <5% was obtained.
Ethical considerations
All study participants signed an informed consent form prior to enrollment. This form explained the purpose of the study, the confidential nature of the information and the mechanisms used to protect the patient’s identity. Participation was voluntary, and patients could refuse to take part in the study with no impact on their health care. Patients had the right to withdraw from the study at any time, according to their wishes.
Informed consent was submitted to the ethics committees of all medical centers for its approval, in accordance with the regulations of the central Ethics Committee. This study was performed in compliance with the Argentina’s Personal Data Protection Act No 25326. The identity of the patients and their personal data were anonymized. Only the investigators, the members of the teaching staff and the research ethics committees (if required) had access to data.
The study was conducted in accordance with the Argentine ethical standards: Act No. 3301, National Law on Clinical Research on Human Subjects, Declaration of Helsinki, (15) among others.
RESULTS
A total of 917 patients were included in the analysis, 291 with troponin I measurement and 626 with troponin T measurement, while 67 values could not be collected. Table 1 shows the baseline characteristics of the patients. The median age was 66 years, 25% of the patients were women, and the median left ventricular ejection fraction (LVEF) was 56%. Regarding medical history, 68% had a diagnosis of hypertension, 57% had dyslipidemia, 26% had diabetes, and 37.7% of patients were smokers. The median GRACE score was 131.2 (IQR 128.8-133.6), and the median CRUSADE score was 24.7 (IQR 23.7-24.7), while the median MS was 5.4 (IQR 1.2-48.2).
Table 1
Baseline Characteristics (n=984)
| Characteristic | Values |
|---|---|
| Age, years - median (IQR) | 66 (56.5-74) |
| Female sex - n (%) | 243 (24.7) |
| Hypertension - n (%) | 671 (68.1) |
| Diabetes mellitus - n (%) | 255 (25.9) |
| Dyslipidemia - n (%) | 560 (56.9) |
| Smoking - n (%) | 377 (37.7) |
| CKD - n (%) | 69 (7) |
| Unstable angina - n (%) | 219 (22.2) |
| STEMI - n (%) | 236 (24) |
| NSTEMI - n (%) | 385 (39.1) |
| Type II infarction - n (%) | 40 (4.1) |
| Heart rate, bpm- median (IQR) | 77 (70-88) |
| Systolic blood pressure, mmHg- median (IQR) | 130 (120-150) |
| LVEF, %- median (IQR) | 56 (45-60) |
| Troponin T - n (%) | 626 (63.6) |
| Troponin I - n (%) | 291 (29.6) |
| GRACE score - median (IQR) | 131.2 (128.8-133.6) |
| CRUSADE score - median (IQR) | 24.7 (23.7-24.7) |
| Multiplier score - median (IQR) | 5.4 (1.2-48.2) |
BPM: beats per minute; CKD: chronic kidney disease; IQR: interquartile range; LVEF: left ventricular ejection fraction; NSTEMI: non-ST-elevation myocardial infarction; STEMI: ST-elevation myocardial infarction.
Regarding events, 38 patients (3.9%) died during hospitalization, and 71 (7.2%) died during the one-year follow-up. Eighty-one patients (8.2%) had an ischemic complication during initial hospitalization, 28 had an AMI and 8 had a CVA/TIA, while 29 patients (2.9%) had a bleeding event (BARC ≥2). During follow-up, 55 patients (5.5%) had ischemic complications, including 14 (1.4%) who presented an AMI and 38 (3.9%) who required revascularization. Table 2 shows detailed ischemic and bleeding events.
Table 2
Ischemic and bleeding events
| Event | Value |
|---|---|
| In-hospital AMI - n (%) | 28 (2.7) |
| In-hospital stroke - n (%) | 8 (0.8) |
| In-hospital bleeding (BARC ≥2) - n (%) | 29 (2.9) |
| In-hospital mortality - n (%) | 38 (3.9) |
| AMI at follow-up - n (%) | 14 (1.4) |
| Stroke at follow-up - n (%) | 3 (0.3) |
| Revascularization at follow-up - n (%) | 38 (3.9) |
| HF at follow-up - n (%) | 22 (2.2) |
| Mortality at follow-up - n (%) | 33 (3.7) |
| Total AMI - n (%) | 42 (4.1) |
| Total stroke - n (%) | 11 (1.1) |
| Total mortality - n (%) | 71 (7.2) |
AMI: acute myocardial infarction; BARC: Bleeding Academic Research Consortium; HF: heart failure.
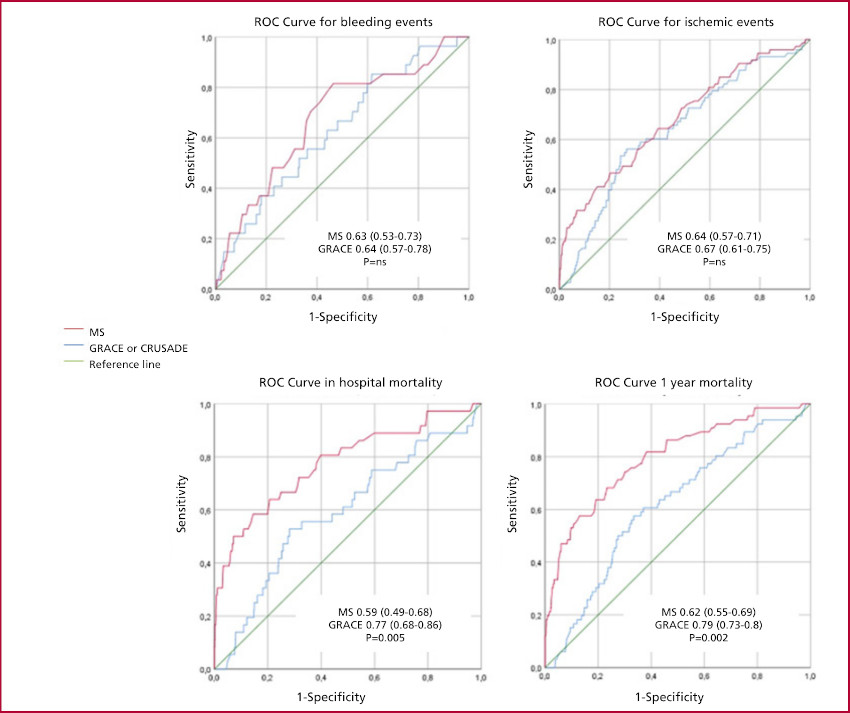
When comparing our score with the GRACE score to predict ischemic events, the AUC ROC of our score was 0.64 (95% CI 0.57-0.71), while that of the GRACE score was 0.67 (95% CI 0.61-0.75), p=0.512. To evaluate the ability to predict bleeding events, we compared our score with the CRUSADE score and obtained an AUC ROC of 0.63 (95% CI 0.53-0.73) versus 0.64 (95% CI 0.57-0.78), p=0.526. Regarding mortality, when comparing the performance for in-hospital mortality, our score had an AUC ROC of 0.59 (95% CI 0.49-0.68), while that of the GRACE score was 0.77 (95% CI 0.68-0.86), p=0.005, demonstrating the superiority of the latter as a predictive factor. However, when analyzing the ability to predict mortality during follow-up, our score had a slightly better value, with an AUC ROC of 0.62 (95% CI 0.55-0.69), but still lower than the GRACE score, 0.79 (95% CI 0.73-0.85), p=0.002. Figure 1 shows the mentioned curves.
DISCUSSION
The heterogeneous distribution of the troponin assays has resulted in a variety of data for troponin levels in ACS. Therefore, unification and interpretation of those results, as well as their use in multicenter studies is challenging. The use of the MS of the 99th percentile of troponin could harmonize the different assays and mitigate those differences. To assess its predictive ability, we compared it with conventional score systems for ischemic events, bleeding events, and mortality. We highlight four findings in our work.
First, for bleeding events, the AUC ROC was 0.63, demonstrating a moderate predictive ability for this endpoint, which was not statistically different from that of the CRUSADE score, 0.64. (13) Other studies have already demonstrated the predictive value of the troponin for bleeding events, such as the study by Mathews et al., which demonstrated an increasing risk based on the troponin level on admission. (16) Iser et al. showed an increased risk of gastrointestinal bleeding in patients with elevated troponin, (17) while Al-Mallah et al. observed an increased overall bleeding risk according to the peak troponin value in acute coronary syndromes. (18) Furthermore, in terms of predictive value, the ABC score to predict bleedings in patients with atrial fibrillation, including biomarkers such as the high-sensitivity troponin, was shown to be superior to that of the HAS-BLED and ORBIT scores. (19) These results could be attributed to the elevated troponin levels generally observed in patients with chronic kidney disease, diabetes or advanced age, among others, where the risk of bleeding is usually higher.
Second, the predictive ability of the MS for ischemic events was modest. The AUC ROC was 0.64, which does not differ significantly from the values from the GRACE score (AUC ROC 0.67), which is the usual predictive tool to calculate ischemic risk in ACS. The ability of the troponin to predict ischemic events has been previously documented in the study by Blankenberg et al., where the troponin I was a predictor of cardiovascular and overall disease and mortality, (20) or in the study by Lindahl that showed similar results. (21,22)
Third, for in-hospital mortality, the MS had limited ability as a predictive factor. The AUC ROC was 0.59 compared with 0,77 of the GRACE score. Although the marker could indicate higher risks, as above mentioned, the GRACE score also includes crucial patient parameters, such as cardiac arrest on admission, the Killip-Kimball assessment, and the incorporation of the patient's hemodynamic status into the equation. (23) Regarding mortality at one-year follow-up, our test showed an improved area under the curve (0.62), although this value was lower than that of the GRACE score (0.79). The above cited Blankenberg study showed that although the troponin is a predictor of mortality, the addition of this biomarker to other risk scores did not significantly modify the area under their ROC curves. (20) The same was documented by Meune et al. in their study, where it was shown that the GRACE score remains useful for determining in-hospital and long-term mortality in patients with ACS in the era of the high-sensitivity troponin, and that its addition, or the addition of the B-type natriuretic peptide (BNP) value to the score did not increase its predictive value. (24) In contrast, the study by Ordoñez et al. showed that troponin T was superior to the GRACE and TIMI scores when predicting adverse events and in-hospital mortality. However, in that study, AUC ROC was 0.52 for the GRACE score, clearly lower than that obtained in our population and that published in the literature, and ST-elevation infarctions were excluded. (25)
Finally, our results highlight that the MS could be a useful tool for data standardization in multicenter settings and for risk assessment in ACS. However, its ability to predict mortality is inferior to that of the established scores, such as GRACE and CRUSADE. This underscores the need to use the troponin to complement, rather than to replace, more comprehensive predictive tools in clinical practice.
Limitations
The retrospective characteristics of the analysis generate biases inherent to the type of study. In addition, the number of events was relatively low, which may make the results unrepresentative. We understand that the wide interquartile range of the MS contrasts with the narrower ranges of the GRACE and CRUSADE scores, although we do not believe that this influences the results. Besides, although centers from all over the country participated, only those centers of medium and high complexity with 24-hour access to hemodynamics were included, so the applicability of the score to patients from centers of lower complexity may be lower.
CONCLUSION
The use of the MS of the 99th percentile of troponin level in ACS may be a useful tool for harmonizing the vast and variable amount of assays and data available today, which hinders the accurate interpretation of information. As a simple tool, this new score system could help to standardize information worldwide
Conflicts of Interest
None declared. (See the authors' conflict of interest forms on the Web).
Financing
No funding was required for this study.