

INTRODUCTION
Calcific aortic stenosis (AS) in adults is the valvular heart disease that most commonly requires surgical or endovascular treatment nowadays due to the aging of the general population. (1) According to the ACC/AHA (2) and ESC guidelines, (3) aortic valve replacement (AVR) is indicated when symptoms (angina, dyspnea or syncope) or impaired left ventricular ejection fraction (LVEF) develop, or in case cardiac surgery is necessary due to other causes. However, AS is not confined to the valve but rather should be considered a systemic disease involving all the cardiac chambers, as well as the pulmonary and systemic vascular systems. In light of this reasoning, a staging classification has been proposed for patients with severe AS to evaluate the extent of extravalvular (anatomical and functional) damage with the aim of improving the indication and prognosis of AVR. (4) However, it is important to note that LV afterload has a valvular component and a vascular component, (5,6) that is not evaluated in the staging classification. The characteristics of the arterial vasculature can have implications for LV function by influencing the ventricular-arterial coupling (VAC), which is evaluated by the relationship between effective arterial elastance (Ea) and LV end-systolic elastance (Ees). (7,8) If the value of the Ea/Ees ratio is ≤ 1 there is adequate coupling between the LV and the arterial vasculature, while a value > 1 indicates uncoupling, suggesting a loss of LV mechanical efficiency. Ea is a parameter of arterial mechanics that is influenced by characteristic impedance and peripheral resistance, (9) while Ees assesses LV contractility independently of preload and afterload. The rise in the age of patients with AS in recent decades has been accompanied by an increase in the prevalence of hypertension (HT), which places an additional load on the LV, in addition to valvular obstruction. (10,11)
The aim of the present study was to evaluate the relationship between VAC and the different stages of extravalvular damage in AS.
METHODS
We prospectively evaluated 205 patients (age 70 ± 11 years, 117 men), with severe AS [aortic valve area (AVA) < 1 cm2] using Doppler echocardiography. The study protocol was approved by the Teaching and Research Committee of our institution. Patients with significant calcification of the mitral annulus, or with moderate or severe aortic or mitral regurgitation were excluded. History of hypertension was considered as the need for previous indication of antihypertensive treatment. History of ischemic heart disease was based on the presence of one of the following criteria or greater: 1) history of myocardial infarction, percutaneous coronary intervention or myocardial revascularization surgery; 2) coronary artery stenosis > 50% documented by angiography; and 3) akinetic segments documented by echocardiography. All the patients underwent complete anamnesis to detect the presence of coronary risk factors and symptoms, cardiovascular physical examination, blood pressure measurement, recording the carotid artery pulse waveform and complete Doppler echocardiography.
Doppler echocardiography: The study was performed with an ESAOTE Mylab 40 ultrasound machine with a 2.5 to 3 MHz transducer. M mode echocardiography and two-dimensional echocardiography were used to calculate LV endocardial fractional shortening (eFS), relative wall thickness (RWT), end-diastolic volume (EDV) estimated by the Simpson's method, end-systolic volume (ESV) and LVEF, according to American Society of Echocardiography (ASE) criteria. (12)
Peak aortic jet velocity, peak gradient (PG) and mean gradient (MG) across the aortic valve and velocity time integral (VTI) were recorded with continuous Doppler echocardiography from the apical view, right parasternal view, subcostal view and suprasternal view. Pulsed-wave Doppler was used to determine LV outflow tract flow from the five-chamber view. The dimensionless index was estimated by dividing the VTI of the left ventricular outflow tract by the VTI of the aortic valve jet. Effective AVA was calculated using the continuity equation, and the AVA index [AVA/body surface area, (BSA)], valvuloarterial impedance (Zva) and energy loss index (ELI) were also measured according to the ASE recommendations. (13) Stroke volume (SV) was calculated by multiplying the cross-sectional area of the LV outflow tract per the VTI of flow at that level; SV index (SVi) was estimated as the ratio between SV and BSA, and transaortic flow rate was calculated by dividing the SV by the LV systolic ejection period. Transmitral flow velocity was recorded by placing the pulsed Doppler sample volume at the level of the mitral valve tips in the four-chamber view to obtain peak E velocity and peak A velocity and thus calculate the E/A ratio. (14) Then, a tissue Doppler imaging sample volume was placed at the lateral and septal portions of the mitral annulus to acquire peak e' velocity in both sites, and the average of both was used to determine the E/e' ratio. (15) Peak tricuspid regurgitation velocity was recorded with continuous Doppler, and this parameter plus the right atrial pressure estimated through the diameter and collapse of the inferior vena cava were used to estimate the systolic pulmonary artery pressure. Right ventricular (RV) systolic function was quantified by the tricuspid annulus plane systolic excursion (TAPSE) and peak systolic velocity of the S wave at the lateral tricuspid annulus. In 168 patients LV longitudinal strain was estimated with two-dimensional speckle tracking echocardiography from the apical four-chamber, two-chamber and apical long-axis views, using the software provided by the device.
Pulse pressure (PP) was estimated as the difference between systolic and diastolic blood pressure measured with a sphygmomanometer. Arterial compliance (AC) was calculated as the SV/PP ratio, (16,17) and for a better comparison between groups, SV was normalized to body surface area: SVi/PP. (18) Systemic vascular resistance (SVR) was calculated as (80 x MBP) /CO (where MBP: mean blood pressure and CO: cardiac output).
After performing Doppler echocardiography, carotid pulse tracing was recorded with a TPW - 01 A pulse transducer connected a TOSHIBA SSH140A machine, and blood pressure was measured in the right arm with the use of a sphygmomanometer. Carotid pulse tracing calibration was carried out according to the method used in our laboratory, (19,20) to obtain end-systolic pressure (ESP) (Figure 1).
Fig. 1
Estimation of end-systolic pressure using the carotid pulse tracing calibrated with blood pressure measured with a sphygmomanometer.
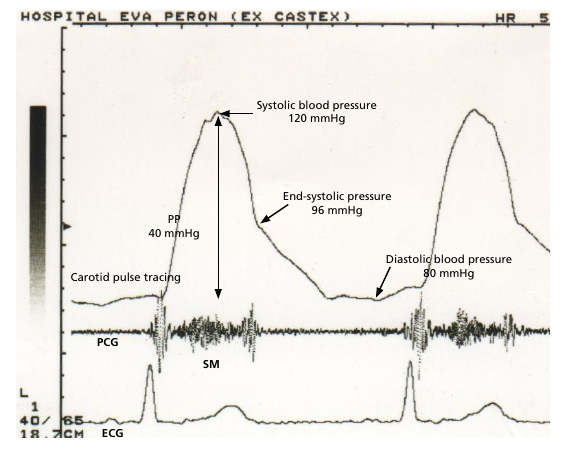
ECG: electrocardiogram; PCG: phonocardiogram; PP: pulse pressure; SM: systolic murmur recorded at the Erb's point.
Assessment of Ees, Ea and VAC: End-systolic elastance was estimated by the method by Senzaki et al. (21) (see supplementary material), Ea was calculated as the SV/ESP ratio and VAC as the Ea/Ees ratio (Figure 2).
Fig. 2
Cardiac cycle in the pressure-volume system with the end-systolic elastance line (Ees) indicating the LV inotropic level and the effective arterial elastance line (Ea).The Ea/Ees ratio determines the value of ventricular-arterial coupling (VAC)
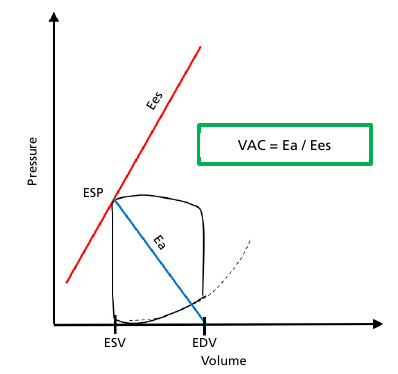
EDV: end-diastolic volume; ESP: end-systolic pressure; ESV: end-systolic volume
Patients were divided into five groups according to the criteria for staging extravalvular cardiac damage proposed by Tastet et al. (22):
a) stage 0, no cardiac damage;
b) stage 1, LV damage (n = 10): LV hypertrophy (LV mass index > 115 g/m2 in men and > 95 g/m2 in women); LV diastolic dysfunction grade 2 or greater (E/e' ratio > 14); subclinical LV systolic dysfunction (LVEF < 60%, global longitudinal strain ≥ -15%);
c) stage 2, left atrial damage or mitral valve damage (n =88): left atrial volume index (LAVi) > 34 mL/m2, ≥ moderate mitral regurgitation, atrial fibrillation;
d) stage 3, pulmonary hypertension or tricuspid valve involvement (n = 7): systolic pulmonary artery pressure ≥ 60 mm Hg, ≥ moderate tricuspid regurgitation;
e) stage 4, right ventricular damage or subclinical heart failure (n =100): RV systolic dysfunction (TAPSE < 17 mm, tricuspid tissue Doppler S wave < 9.5 cm/s), moderate to severe low flow (SVi < 30 mL/m2).
Patients were assigned to each group based on at least one criterion in the most advanced stage. For example, a patient with TAPSE < 17 mm was categorized as stage 4 even in the absence of pulmonary hypertension, mitral valve involvement or LVEF < 60%.
Statistical analysis
All the statistical calculations were performed using SPSS 25 software package. Continuous variables were expressed as mean ± standard deviation. The groups were compared using analysis of the variance. A p-value < 0.05 was considered statistically significant.
RESULTS
Table 1 shows the cardiovascular risk factors, comorbidities and symptoms of the patients evaluated. There were no patients in stage 0. Hypertension was the most common risk factor. Symptoms were present in 40 % of stage 1 patients, 85 % of stage 2 and 100 % of stages 3 and 4. Class III-IV dyspnea was the most common symptom. Stage 1 patients were younger (57 ± 13 years, p < 0.01) compared to the rest of the patients (Table 2). There were no significant differences between the different groups when considering BSA, systolic blood pressure, diastolic blood pressure, ESP and heart rate.
Table 1
Cardiovascular risk factors, comorbidities and patients' symptoms
| Cardiovascular risk factors and comorbidities | % |
| Coronary artery diseases | 24 |
| Previous myocardial infarction | 10 |
| Hypertension | 59 |
| Diabetes | 17 |
| Dyslipidemia | 30 |
| Current smoking | 28 |
| Obesity (BMI > 30 Kg/m2) | 21 |
| Chronic obstructive pulmonary disease | 4 |
| Symptoms (%) | % |
| Angina | 15 |
| Syncope | 3 |
| FC I-II dyspnea | 27 |
| FC III-IV dyspnea | 48 |
BMI: body mass index; FC: functional class.
Table 2
Clinical parameters
| Total | Stage 1 | Stage 2 | Stage 3 | Stage 4 | |
|---|---|---|---|---|---|
| n = 205 | n = 10 | n = 88 | n = 7 | n = 100 | |
| Age (years) | 69 ± 11 | 57 ± 13 | 69 ± 11 * | 73 ± 9 * | 70 ± 11 * |
| Body surface area (m2) | 1.83 ± 0.2 | 1.72 ± 0.15 | 1.82 ± 0.2 | 1.76 ± 0.09 | 1.86 ± 0.21 |
| Systolic blood pressure (mm Hg) | 128 ± 23 | 130 ± 19 | 132 ± 21 | 132 ± 19 | 124 ± 25 |
| Diastolic blood pressure (mm Hg) | 74 ± 13 | 77 ± 11 | 75 ± 12 | 71 ± 19 | 74 ± 13 |
| End-systolic pressure (mm Hg) | 96 ± 19 | 95 ± 18 | 98 ± 19 | 91 ± 17 | 95 ± 19 |
| Heart rate (beats per minute) | 71 ± 13 | 71 ± 11 | 69 ± 11 | 72 ± 19 | 75 ± 13 |
Quantitative variables are presented as mean ± standard deviation. *p < 0.01 vs. Stage 1
LV systolic function (Table 3): ventricular dimensions and volumes exhibited a significant increase from stage 2 to 4 when compared to stage 1. According to LV mass index and RWT, concentric hypertrophy was the predominant geometry type in all groups. Left ventricular ejection fraction was significantly reduced in stages 3 and 4, although 40 % of patients in stage 1 and 36% in stage 2 had LVEF < 60% (subclinical systolic dysfunction). Left ventricular longitudinal strain presented a progressive reduction from stage 2 to 4, with statistically significant differences between groups. Stroke volume index and aortic flow were significantly lower in stage 4, with SVi < 30 mL/m2 in 82% of patients in this group.
Table 3
Incidence of the components of each stage of extravalvular damage
| Stage 1 | Stage 2 | Stage 3 | Stage 4 | |
|---|---|---|---|---|
| n = 10 | n = 88 | n = 7 | n = 100 | |
| n (%) | n (%) | n (%) | n (%) | |
| Stage 1 | ||||
| LV hypertrophy | 9 (90 %) | 83 (94 %) | 7 (100 %) | 90 (90 %) |
| LVEF < 60 % | 4 (40 %) | 32 (36 %) | 6 (86 %) | 70 (70 %) |
| E/e' ratio > 14 | 35 (40 %) | 3 (43 %) | 51 (51 %) | |
| Global strain ≥ -15 % * | 38/74 (51 %) | 4/5 (80 %) | 71/89 (80 %) | |
| Stage 2 | ||||
| LA enlargement | 88 (100 %) | 7 (100 %) | 94 (94 %) | |
| Atrial fibrillation | 2 (2 %) | 1 (14 %) | 14 (14 %) | |
| ≥ moderate mitral regurgitation | 8 (10 %) | 4 (57 %) | 29 (29 %) | |
| Stage 3 | ||||
| SPAP ≥ 60 mm Hg | 6 (86 %) | 10 (10%) | ||
| ≥ moderate tricuspid regurgitation | 5 (71 %) | 13 (13 %) | ||
| Stage 4 | ||||
| TAPSE < 17 mm | 30 (30 %) | |||
| S-wave TDI < 9.5 cm/s | 33 (33 %) | |||
| LV stroke volume index< 30 mL/m2 | 82 (82 %) | |||
LA: left atrial; LV: left ventricular; LVEF: left ventricular ejection fraction; SPAP: systolic pulmonary artery pressure; TAPSE: tricuspid annulus plane systolic excursion; TDI: tissue Doppler imaging. * % correspond to a total of 168 patients
Aortic stenosis: there were no significant differences between patients in stages 1 to 3 when considering peak aortic jet velocity, PG and MG, AVA, aortic valve area index (AVAi), Zva and ELI (Table 4). Patients in stage 4 exhibited lower gradients but more severe aortic stenosis, as indicated by measurements of AVA, AVAi, Zva and ELI. This suggests a higher degree of disease involvement at the valvular level.
Table 4
Echocardiographic parameters
| Total | Stage 1 | Stage 2 | Stage 3 | Stage 4 | |
|---|---|---|---|---|---|
| n = 205 | n = 10 | n = 88 | n = 7 | n = 100 | |
| LV systolic function | |||||
| LV diastolic dimension (cm) | 5.3 ± 0.9 | 4.7 ± 0.9 | 5.1 ± 0.7 ° | 5.5 ± 1 * | 5.4 ± 0.9 * |
| LV systolic dimension (cm) | 3.7 ± 1 | 2.8 ± 0.6 | 3.3 ± 0.9 ° | 4 ± 1.2 * | 4 ± 1.1 * |
| LV fractional shortening (%) | 31 ± 11 | 41 ± 7 | 36 ± 10 ° | 29 ± 9 * | 27 ± 11 * |
| LV posterior wall thickness (cm) | 1.2 ± 0.2 | 1.2 ± 0.2 | 1.2 ± 0.2 | 1.3 ± 0.2 | 1.2 ± 0.2 |
| Interventricular septal thickness (cm) | 1.3 ± 0.2 | 1.3 ± 0.2 | 1.4 ± 0.2 | 1.4 ± 0.2 | 1.3 ± 0.3 |
| Relative wall thickness | 0.48 ± 0.11 | 0.52 ± 0.14 | 0.48 ± 0.09 | 0.49 ± 0.10 | 0.46 ± 0.13 |
| LV mass (g) | 291 ± 96 | 233 ± 99 | 283 ± 89 | 344 ± 116 | 300 ± 98 |
| LV mass index (g/m2) | 158 ± 47 | 134 ± 52 # | 154 ± 42 # | 196 ± 66 | 162 ± 48 |
| LV end-diastolic volume (mL) | 119 ± 59 | 76 ± 59 | 105 ± 44 * | 165 ± 48 * ∆ | 132 ± 66 * ∆ |
| LV end-systolic volume (mL) | 65 ± 54 | 32 ± 40 | 46 ± 36 | 104 ± 52 * ∆ | 81 ± 61* ∆ |
| LV ejection fraction (%) | 52 ± 19 | 65 ± 6 | 60 ± 16 | 40 ± 17 * ∆ | 46 ± 19 * ∆ |
| LV stroke volume index (mL/m2) | 33 ± 11 | 40 ± 8 | 40 ± 10 | 41 ± 8 | 26 ± 8 * ∆ # |
| LV stroke volume index< 30 mL/m2, n (%) | 82 (82) | ||||
| Transaortic flow rate (mL/s) | 184 ± 52 | 212 ± 44 | 208 ± 48 | 227 ± 47 | 156 ± 40 * ∆ # |
| End-systolic stress (g/m2) | 50 ± 27 | 32 ± 12 | 42 ± 20 | 48 ± 17 | 59 ± 32 |
| LV global longitudinal strain (%) | - 13 ± 4 | - 20 ± 4 | - 14 ± 4 * | - 10 ± 4 * ∆ | - 10 ± 4 * ∆ |
| Aortic stenosis | |||||
| Peak aortic jet velocity (m/s) | 4 ± 0.93 | 3.95 ± 0.74 | 4.32 ± 0.83 | 4.18 ± 0.88 | 3.86 ± 0.99 ∆ |
| Peak gradient (mm Hg) | 70 ± 31 | 62 ± 25 | 76 ± 28 | 71 ± 27 | 64 ± 23 ∆ |
| Mean gradient (mm Hg) | 41 ± 19 | 35 ± 13 | 46 ± 18 | 40 ± 16 | 38 ± 21 ∆ |
| Dimensionless index | 0.21 ± 0.06 | 0.25 ± 0.06 | 0.22 ± 0.06 | 0.25 ± 0.08 | 0.19 ± 0.06 * ∆ # |
| Aortic valve area (cm2) | 0.67 ± 0.21 | 0.79 ± 0.22 | 0.72 ± 0.20 | 0.81 ± 0.21 | 0.61 ± 0.20 * ∆ # |
| Aortic valve area index (cm2/m2) | 0.37 ± 0.12 | 0.46 ± 0.13 | 0.40 ± 0.11 | 0.47 ± 0.13 | 0.33 ± 0.11 * ∆ # |
| Valvuloarterial impedance (mm Hg/mL/m2) | 5.4 ± 1.8 | 4.1 ± 1 | 4.4 ± 1 | 5.1 ± 2 | 6.3 ± 2 * ∆ |
| Energy loss index (cm2/m2) | 0. 42 ± 0.15 | 0.52 ± 0.16 | 0.45 ± 0.14 | 0.54 ± 0.17 | 0.37 ± 0.14 * ∆ # |
| LV diastolic function | |||||
| E/A ratio | 1.24 ± 0.9 | 0.72 ± 0.24 | 1 ± 0.47 * | 2 ± 0.9 * ∆ | 1.5 ± 1.1 * ∆ |
| E/e' ratio | 16 ± 8 | 9 ± 2 | 15 ± 7 * | 21 ± 12 * | 17 ± 8 * |
| LA volume index (mL/m2) | 56 ± 19 | 29 ± 4 | 55 ± 17 * | 71 ± 13 * ∆ | 58 ± 20 * ∆ |
| Mitral regurgitation, n (%) | - | 14 (16) | 7 (100) | 62 (62) | |
| Tricuspid valve, right ventricle and systolic pulmonary artery pressure | |||||
| Mild tricuspid regurgitation, n (%) | 1 (10) | 26 (30) | 2 (29) | 32 (32) | |
| ≥ moderate tricuspid regurgitation, n (%) | 5 (71) | 13 (13) | |||
| Systolic pulmonary artery pressure (mm Hg) | 46 ± 17 | 25 | 40 ± 12 | 67 ± 17 ∆ ° | 43 ± 17 ∆ |
| TAPSE (mm) | 20 ± 6 | 22 ± 4 | 23 ± 5 | 20 ± 7 ° | 17 ± 6 *∆ |
| Tricuspid S-wave TDI (cm/s) | 11 ± 3 | 12 ± 1 | 13 ± 2 | 10 ± 2 ∆ | 10 ± 3 ∆ |
| Systemic arterial hemodynamics | |||||
| Arterial compliance (mL/mm Hg) | 1.24 ± 0.53 | 1.4 ± 0.48 ° | 1.4 ± 0.53 ° | 1.4 ± 0.71 | 1.1 ± 0.48 |
| Arterial compliance index (mL/m2/mm Hg) | 0.68 ± 0.29 | 0.82 ± 0.31 ° | 0.77 ± 0.28 ° | 0.8 ± 0.41 ° | 0.58 ± 0.24 |
| Systemic vascular resistance (dynes/s/cm-5) | 1905 ± 631 | 1664 ± 493 ° | 1639 ± 436 ° | 1605 ± 810 ° | 2181 ± 661 |
| Ventricular-arterial coupling | |||||
| Ea (mm Hg/mL) | 1.78 ± 0.69 | 1.45 ± 0.44 | 1.43 ± 0.46 ° | 1.57 ± 0.72 ° | 2.13 ± 0.71 * |
| Ees (mm Hg/mL) | 2.15 ± 1.49 | 3 ± 1.25 ∆ | 2 ± 1.1 | 1.9 ± 1.2 * | 2 ± 1.19 * |
| Ventricular-arterial coupling | 1.13 ± 0.76 | 0.63 ± 0.41 | 0.88 ± 0.54 | 0.91 ± 0.61 | 1.40 ± 0.85 * ∆ # |
Ea: effective arterial elastance; Ees: end-systolic elastance; LA: left atrial; LV: left ventricular; TAPSE: tricuspid annulus plane systolic excursion. Δ p < 0.01 vs. Stage 2; # p < 0.05 vs. Stage 3; ° p < 0.01 vs. Stage 4; * p < 0.01 vs. Stage 1
LV diastolic function: E/A ratio, E/e' and LAVi increased significantly from stage 2 to 4.
Mitral regurgitation: moderate mitral regurgitation or greater was more common in stages 3 and 4.
Tricuspid regurgitation, RV and systolic pulmonary artery pressure: mild tricuspid regurgitation occurred in one third of patients in stages 2, 3 and 4, whereas moderate or severe regurgitation was more frequent in stage 3 than in stage 4, probably because systolic pulmonary artery pressure was higher in stage 3 than in stage 4. Longitudinal RV systolic function assessed by TAPSE and peak systolic velocity at the lateral tricuspid annulus was reduced in stages 3 and 4.
Systemic arterial hemodynamics: AC and SVR were abnormal only in stage 4, with no significant differences between stages 1, 2 and 3.
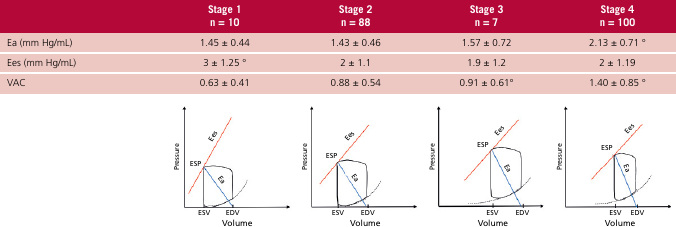
Ventricular-arterial coupling: unlike AC and SVR, Ea increased from stage 2 to stage 4 indicating increased arterial stiffness and higher vascular load. End-systolic elastance, which assesses LV contractility, showed no changes in these groups (value greater than 1 in all stages) evidencing preserved contractility, although it decreased from stage 1 to 2 (3 ± 1.25 vs. 2 ± 1.1, p < 0.01). Ventricular-arterial coupling exhibited progressive alterations from stage 1 to 4, mainly as a result of the increase in Ea (Figure 3).
Fig. 3
Top: table with Ea, Ees and VAC values for each of the extravalvular damage stages. Bottom: the same values are represented in the pressure-volume system. The values of end-systole volume (ESV), end-diastolic volume (EDV) and end-systole pressure (ESP) correspond to the average values of each stage.
DISCUSSION
The main finding of the present study is that the progression of extravalvular damage in AS is related to the alteration of VAC, suggesting that such damage is not only due to the valvular component, but also to the characteristics of the systemic arterial vasculature. Généreux et al. (5) described a five-stage classification of extravalvular (anatomical and functional) damage in AS in 1661 patients from the PARTNER 2A and 2B studies who underwent AVR. Subsequently, the same authors published the impact of determining the stage of extravalvular damage at one year after AVR (23) and the correlation with quality of life according to the Kansas Cardiomyopathy Questionnaire. (24) To better define the compromise of LV function, global longitudinal strain was incorporated, improving the prognostic value of the previously described classification. (25) We use the stage classification proposed by Tastet et al., (9) which establishes a cut-off point for LVEF of less than 60% for stage 1. We consider this to be more appropriate than a value of less than 50% in the presence of concentric hypertrophy, a geometry that exaggerates the movement of the endocardium used to calculate LVEF. (26,27) In the aforementioned studies, stage 4 patients represent between 7.1% and 8.7% of the total population, while in our study 49%, were in stage 4 and no patients were in stage 0. This difference may be due to the lack of early diagnosis, as most patients with heart failure did not know they had valvular heart disease, a fact commonly observed in public hospitals.
With regard to the severity of AS, there were no differences between stages 1 to 3 in terms of gradients, AVA, AVAi and ELI. Therefore, we can consider that the valvular load was the same in the three stages. This did not occur in stage 4 patients, in whom AS was more severe. However, VAC exhibited progressive alterations from stage 2 to 4 at the cost of increased Ea with no decline in LV contractility (Ees) (Figure 3).
It should be noted that in AS the relationship with the afterload is more complex than would be expected (28,29,30) because of the effect of the obstruction of the left ventricular outflow tract (valvular load) added to the forces that resist ventricular ejection. These forces depend on the physical characteristics of the arteries (vascular load), (31) and include arterial impedance, determined by the phasic relationship between aortic pressure and aortic volume, SVR, aortic wall stiffness, (32) inertial properties of blood and properties of the reflection waves produced in arterial bifurcations. (33,34,35) Of the indexes evaluating arterial mechanics, Ea seems to be more adequate than AC, because it incorporates the characteristic impedance, resistance, compliance and cycle length. (36,37) A parameter that evaluates global (valvular and vascular) load in AS is Zva. However, despite an increase in Zva due to the high prevalence of hypertension, no significant differences were observed between the different stages, except for stage 4.
The alteration of VAC correlates with the development of symptoms and heart failure, with the rise in Ea outweighing the decline in Ees. In the present study, LVEF was found to be diminished, particularly in stages 3 and 4 (86% and 70%, respectively), despite the presence of preserved contractility according to Ees. This is explained by the afterload mismatch, that is the uncoupling between afterload and inotropism between chamber function (LVEF) and muscle function (Ees) in AS. (16,39) The same concept could be applied to strain, which progressively decreased from stage 2 to 4 before the decline in LVEF, since strain had a positive correlation with the increase in Ea (r =0.43, p < 0.001, y = 0.0715. x+ 2) evidencing its dependence on afterload as it occurs with any index that evaluates fiber shortening. Therefore, it should be considered that the decrease in strain or LVEF is not only due to valvular load but also to vascular load.
CONCLUSION
As the stage of myocardial damage progresses, the impairment of VAC increases. The alteration of VAC that occurs from stage 2 to 4 is due to an increase in Ea without significant changes in the level of contractility (Ees). The progression of extravalvular myocardial damage appears to be associated not only with valvular disease but also with the characteristics of the arterial vasculature.
Ethical considerations
Not applicable
Conflicts of interest
The authors declare that they have no conflicts of interest (see authors' conflict of interest forms on the Web).