
INTRODUCTION
Excess weight, defined as a body mass index (BMI) ≥ 25, affects more than 50% of the Western population and 62.5% of the population of the World Health Organization Region of the Americas. (1) This issue has emerged as a major public health concern in the 21st century, underscoring its global health priority due to its increasing prevalence and its association with various complications such as type 2 diabetes, hypertension, heart failure, dyslipidemia, osteoarthritis, obstructive sleep apnea, depression and several types of cancer. (2) Since 1975, obesity rates have almost tripled, affecting people of all ages and social groups worldwide and have increased by almost five times in children and adolescents. (3) In Argentina, there has been a clear upward trend in the prevalence of overweight and obesity across all age and social groups over the years, particularly among the most socially vulnerable groups (4) and has increased from the third edition of the National Survey of Risk Factors (ENFR), where it was 57.9%, to the fourth edition, where it reached 61.6%. Clearly, the trend continues to rise compared to the previous three editions. (5)
While other anthropometric measures are also currently used to better stratify the risk of excess body fat and fat distribution is also considered, BMI is the most validated and widely used tool worldwide. (6) Although BMI can be easily calculated, it requires the availability of a scale and an altimeter which may not be present in all medical offices. Additionally, the measurement process can be time-consuming. Therefore, the trend is to rely on weight and height self-reported by the patient or a family member. Alternatively, a BMI category is assigned according to the subjective perception of the physician. The aim of the present study was to 1) evaluate the concordance between subjective estimates of weight and height and the actual measurements, 2) analyze if there is agreement between BMI categories as determined by objective measurements and as perceived by physicians, and 3) assess if there is inter-observer variability in subjective perceptions of weight, height and BMI category.
METHODS
We conducted an observational and cross-sectional study. Hospitalized patients in the Cardiology Service who were able to ambulate and could be weighed and measured were included in the study. Pregnant patients and those with cachexia, edema, ascites or heart failure were excluded.
Each patient was evaluated by three different physicians. One physician performed the objective measurement of weight and height and calculated the BMI according to the formula. (7) The remaining two physicians examined the patient at different times on the same day, each documenting their subjective assessment of the patient's weight and height and BMI category on the record sheet.
Statistical analysis
Qualitative variables are presented as percentages and were compared with the chi-square test or Fisher's test. Quantitative variables are presented as mean and standard deviation (SD) or median and interquartile range (IQR). Cohen's Kappa index was used to assess the agreement between the diagnoses of the different BMI categories, considering the following cut-off points < 0: poor, 0 - 0.20: slight, 0.21 - 0.40: fair, 0.41 - 0.60: moderate, 0.61 - 0.80: substantial and 0.81 - 1.0: excellent. The Bland-Altman plot method was used to estimate the differences in the measurements of the variables. This analysis permitted the evaluation of both systematic bias and the dispersion between the two methods evaluated. A p value < 0.05 was considered statistically significant.
A difference greater than 5 kg in weight and greater than 5 cm in height between the actual and estimated measurements, as well as between those estimated by different operators was considered clinically significant. All the statistical calculations were performed using Stata 22 software package.
Ethical considerations
Informed consent was not required since the information was anonymized and obtained noninvasively.
RESULTS
A total of 87 patients were included; median age was 59 years (IQR 37-72) and 54% were men.
Table 1 shows the percentage of measurements with significant variations (> 5 or 10 kg) in weight or > 5 cm in height.
Table 1
Percentage of significant differences between subjective perceptions of operators 1 and 2 versus actual measurements and those of operator 1 versus operator 2
| Measurements | DIF > 5 KG (%) | DIF > 10 KG (%) | DIF > 5 cm (%) |
|---|---|---|---|
| Subjective 1 vs. objective | 60.92 | 29.1 | 44.8 |
| Subjective 2 vs. objective | 58.62 | 28.8 | 44.8 |
| Subjective 1 vs. subjective 2 | 63.22 | 43.7 | 59.7 |
DIF: difference
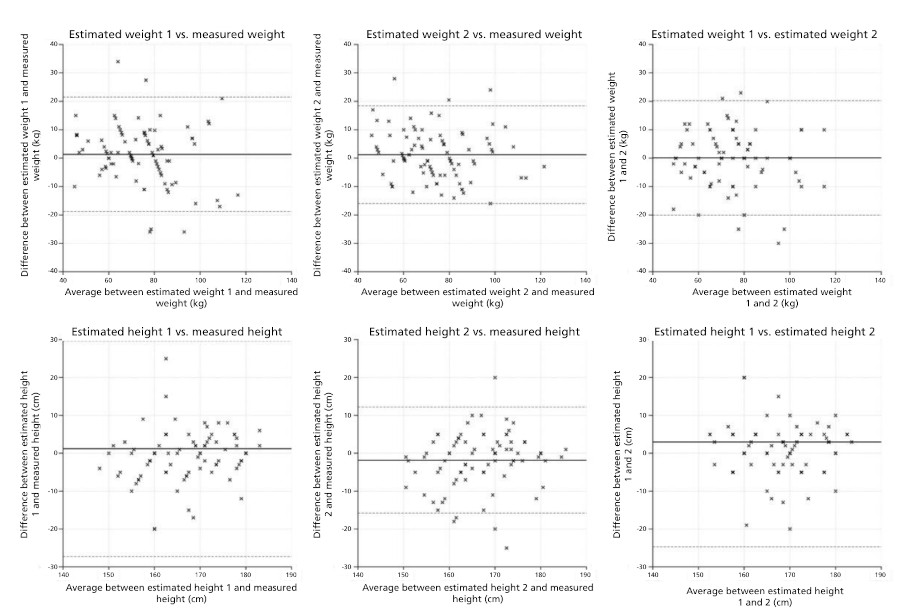
The Bland Altman plots (Figure 1) illustrate the distribution of the subjective measurements compared with the actual one and the distribution between subjective perception 1 and 2.
Fig. 1
Bland Altman plots for the analysis of differences in weight (top, in kg) and height (bottom, in cm) between the values estimated by the different operators and measured values.
In the objective calculation of BMI, 8 patients (9%) were UW, 26 (30%) had normal weight NW, 35 (40%) OW and 18 (21%) were obese. Table 2 shows the categories according to objective measurements of the patients and how many of them are assigned to other categories according to the subjective perception of the operators. The coincidence between the objective determination and the subjective estimation is remarked green. The underestimation of OW stands out, in one third of the patients for observer 1 and almost 50% for observer 2. When the objective determinations of NW and OW were compared with the subjective determinations of observer 1, the subjective determinations of observer 2 and the two subjective determinations with each other, Cohen's kappa indices ranged from 0.3 to 0.5, so the agreement was low. Agreement was somewhat better in the extreme categories: underweight and obesity (Table 3).
Table 2
Assignment to different BMI categories according to the subjective perceptions of operators 1 and 2
| N:87 | Subjective measurement 1 | Subjective measurement 2 | |||||||
|---|---|---|---|---|---|---|---|---|---|
| Objective measurement | n | UW | NW | OW | O | UW | NW | OW | O |
| n | 6 (6.89) | 37 (42.53) | 25 (28.74) | 19 (21.84) | 6 (6.8) | 42 (48.2) | 21 (24.1) | 17 (19.5) | |
| UW | 8 (9) | 5 | 2 | 1 | 0 | 4 | 4 | 0 | 0 |
| NW | 26 (30) | 1 | 22 | 2 | 1 | 2 | 20 | 2 | 2 |
| OW | 35 (40) | 0 | 12 | 18 | 5 | 0 | 17 | 11 | 7 |
| O | 18 (21) | 0 | 1 | 4 | 13 | 0 | 1 | 8 | 9 |
BMI: body mass index; NW: normal weight; O: obesity; OW: overweight; UW: underweight
DISCUSSION
Excess weight is an epidemic in the Western world associated with increased risk of diabetes and cardiovascular disease. A BMI ≥ 25 kg/m2 is the most common tool used to define excess weight. While it is a simple measure to obtain, it is not typically collected during physical examination because physicians generally categorize patients based on the patient's self-reported information or on their own clinical assessment. While some reports indicate that self-reported weight is generally consistent with measured weight, (8,9) discrepancies have been observed in studies ranging from 20 to 84%. (10,11,12,13,14) These inconsistencies have been observed in self-reported BMI and in reports from family members. This lack of association is influenced (among other factors) by sex, age and socioeconomic level. (15,16,17) Women tend to underestimate their weight while men tend to overestimate their height. It has also been demonstrated that, irrespective of other sociodemographic factors, there are differences in the self-reported incidence of overweight and obesity among the ethnic groups analyzed. (18)
Our study revealed significant and clinically relevant differences in both weight and height measurements, with these subjective measurements being erroneous in more than half of the patients. Additionally, there is significant variability in the subjective perception of physicians. Strikingly, the estimated differences in weight and height between physicians' impressions and the actual ones are significantly greater than those observed in self-reported weight and height. (19,20,21)
The assignment to a given BMI category based on self-reported data compared to objective measurement is also subject to bias and may lead to errors in categorization (22,23). In this sense, physicians tend to overestimate normal weight and underestimate overweight. There is a higher probability of a correlation between subjective perception and objective measurement, as well as interoperator agreement, in the extreme categories of underweight and obesity.
There are no similar studies in the literature, so we cannot compare our results. However, due to the high margin of error in subjective clinical assessments, the low cost of necessary equipment, and the ease of obtaining objective measurements, we believe it is crucial to share our findings. This will help us correctly classify our patients and perform the necessary interventions without avoidable biases.
Conflicts of interest
None declared. (See authors' conflict of interests forms on the web).