
INTRODUCTION
Hypertrophic cardiomyopathy (HCM) is the most common genetic heart disease, with a prevalence of up to 1 in 500 people. (1) It is a complex and variable disease in terms of pathophysiology, clinical presentation, prognosis and survival, and is the leading cause of sudden cardiac death in young people and athletes. However, most patients are asymptomatic, which complicates the diagnostic process. Genetic HCM usually corresponds to a single gene disorder with an autosomal dominant pattern of inheritance. (2) Most variants or mutations detected are in genes encoding sarcomere proteins. (3) The percentage of positive genetic testing (GT) varies according to phenotype, but it can reach 70-80% in selected groups. (4) The identification of the genetic basis of HCM is not only a reason to perform cascade genetic screening in family members, but also provides valuable prognostic information. (5,6) Nevertheless, this tool is not yet routinely used due to its high cost and limited availability. Defining the group of patients in whom a positive GT is most likely to occur may be useful in addressing this issue.
OBJECTIVES
The aim of this study was to describe the clinical characteristics and the results of diagnostic tests in a cohort of patients with HCM who were being followedup at a non-specialized center, and to analyze which variables are significantly associated with positive GT.
METHODS
A retrospective cohort study was conducted on patients evaluated at a non-specialized center from January 2022 to January 2025, with a diagnosis of HCM made by transthoracic color Doppler echocardiography (TTE) and defined by a left ventricular (LV) wall thickness ≥15 mm in at least one myocardial segment. The cohort also included relatives of patients with a diagnosis of HCM based on the presence of LV wall thickness ≥13 mm. In all cases, increased wall thickness could not be explained by the presence of hypertension, other heart disease, systemic disease, or congenital heart disease. (1) The clinical data, family history and the results of electrocardiogram (ECG), TTE, exercise stress test, ECG Holter monitoring, cardiac magnetic resonance (CMR) with gadolinium-based contrast agent and the results of GT (when available) were analyzed. Patients exhibiting phenocopies, including amyloidosis and Fabry disease, along with those with other causes of heart disease such as severe valvular heart disease were excluded from the study.
Genetic testing
GT was performed using next-generation sequencing (NGS) based on a panel of hypertrophic cardiomyopathies which should include, at least, a basic panel. This panel contains the core genes, i.e., those with sufficient clinical and functional evidence to be considered associated with the disease, as well as genes related to the main phenotypes of this condition. (1,7) The panels used encompassed the analysis of at least 10 sarcomeric genes (MYH7, MYBPC3, TNNT2, TPM1, MYL2, MYL3, TNNI3, TNNC1, TPM1, ACTC1, and CSRP3), four genes from other myocyte cell structures (PTPN11, PLN, JPH2, DES), and four genes associated with storage diseases (GLA, LAMP2, PRKAG2, TTR) to rule out phenocopies. Deoxyribonucleic acid (DNA) was extracted from whole blood spotted on filter paper or from saliva using an automated method. Single nucleotide variants (SNVs) and small insertions and deletions (indels) were identified with a minimum coverage of 20 fragments ≥ 98%. The variants were classified following the guidelines of the American College of Medical Genetics and Genomics 2015 (ACMG) (8) and were characterized as pathogenic, likely pathogenic (90% certainty of a variant being disease-causing), variants of uncertain significance (VUS), likely benign (90% certainty of a variant being benign), or benign.
Statistical analysis
Categorical variables are presented as frequencies and percentages and were compared using the chi-square test or Fisher's test, as appropriate. Continuous variables with normal distribution are expressed as mean ± standard deviation (SD) and those with non-normal distribution as median and interquartile range (IQR). Normality of distribution was assessed using graphical methods (histogram or plots) or the Shapiro Wilk test. Quantitative variables were compared using the Student's t test or the Wilcoxon rank sum test, as appropriate. The association of the evaluated variables with positive genetic test results was investigated through the analysis of a contingency table. All those variables with a p-value < 0.10 as well as those considered clinically relevant were included in a multivariate logistic regression model to define the variables independently associated with a positive GT result. A p-value < 0.05 was considered statistically significant.
Ethical considerations
The study protocol was reviewed and approved by the institutional review board. The investigation was conducted following the recommendations of the Declaration of Helsinki. (9) All the patients gave their informed consent before participating in the study.
RESULTS
A total of 72 patients were included; mean age was 54 ± 16 years and 55 (76.4%) were men. Twenty-seven patients (37.5%) had a family history of HCM or sudden cardiac death. Twenty-nine patients (40.3%) had hypertension, which was mild in all cases and was being treated with a single drug. The presence of any symptoms was reported by 43 patients (59.7%), the most common being dyspnea. Electrocardiographic changes occurred in 83.3% of patients (n=60), 41.7% presented criteria for left ventricular hypertrophy (LVH), and 61.1% had negative T waves. Twentyeight patients (39.4%) had left ventricular outflow tract obstruction (LVOTO), and septal reduction therapy had been indicated in 4 (5.5%). A total of 9 patients (12.5%) had an implantable cardioverter- defibrillator (ICD) for the primary or secondary prevention of sudden cardiac death. The most common patterns of LVH on echocardiography were reverse septal curvature in 33 (45.8%), sigmoid septum in 29 (40.3%), and apical hypertrophy in 8 (11.1%). Mean maximal wall thickness measured by echocardiography was 18.5± 3.9 mm. Sixty-one patients underwent CMR, which revealed late gadolinium enhancement (LGE) in 49 cases (81.7%), predominantly mild (less than< 5% of myocardial mass). Only 16 patients exhibited extensive LGE (> 15% myocardial mass). The average sudden cardiac death risk score (HCM Risk- SCD score) recommended by the European Society of Cardiology(ESC) (10) was 2.7±1.9 (risk <4% at 5 years). The remaining parameters are described in Table 1.
Table 1
Baseline characteristics of the population (n=72)
| Variable | Value |
|---|---|
| Age, years | 46.4 ±16.3 |
| Male gender | 55 (76.4) |
| Family history of HCM | 27 (37.5) |
| High blood pressure | 29 (40.3) |
| Atrial fibrillation | 19 (26.4) |
| Implantable cardioverter-defibrillator | 9 (12.5) |
| Symptoms | 43 (59.7) |
| ECG | |
| Signs of LVH | 30 (41.7) |
| Negative T waves | 44 (61.1) |
| TTE | |
| Maximum septal thickness, mm | 18.57 ±3.9 |
| Reverse septal curvature | 33 (45.8) |
| Sigmoid septum | 29 (40.3) |
| Apical LVH | 8 (11.1) |
| Dynamic LV obstruction | 28 (39.4) |
| ≥ mild mitral regurgitation | 45 (61.4) |
| Mitral valve systolic anterior motion | 29 (41.4) |
| LVEF, % | 60 ± 11 |
| Left atrial diameter, mm | 42.5± 6.6 |
| ≥ Mild diastolic dysfunction | 62 (85.7) |
| CMR | |
| Maximum thickness, mm | 19.1 ± 5.3 |
| Mitral valve abnormality | 27 (45) |
| Apical displacement of papillary muscles | 19 (33.3) |
| LGE | 49 (81.7) |
| HCM Risk-SCD score | 2.7 ± 1.9 |
CMR: cardiac magnetic resonance imaging; ECG: electrocardiogram; HCM: hypertrophic cardiomyopathy; LVEF: left ventricular ejection fraction; LVH: left ventricular hypertrophy; mm: millimeters; LGE: late gadolinium enhancement; TTE: transthoracic echocardiography
Qualitative variables are presented as frequency and percentage, and quantitative variables as mean ± standard deviation.
Although GT was routinely indicated in all patients to avoid selection bias, it was eventually performed in 41 of the 72 patients (57%) due to issues related to lack of coverage, costs, or patient refusal. When these 41 patients were compared with the remaining 31, no significant differences were found in the most relevant clinical variables, nor in the findings on echocardiogram or CMR.
In 13 (31.7%) of the genetic panels performed, a positive result was obtained for a sarcomere protein mutation (G+ group): 5 in MYBPC3, 5 in MYH7, 2 in TNNT2, and 1 in FLNC. The remaining 28 cases (68.3%) were negative results or VUS in genes not phenotypically associated with HCM (G- group). G+ patients were younger at the time of diagnosis (mean age 38.4± 15.3 vs. 50.8± 11.7 years, p = 0.007). Gender and cardiovascular risk factors were similar in both groups. There were no differences in the presence of symptoms (dyspnea, angina, palpitations, or syncope). Regarding the ECG, negative T waves were more prevalent in G+ patients (92.3% vs. 42.9%, p = 0.003). These patients also exhibited a higher incidence of non-sustained ventricular tachycardia (NSVT) on ECG Holter monitoring (61.5% vs. 10.5%, p = 0.002). On imaging tests, the reverse septal curvature phenotype of LVH was more common in G+ patients (84.6% vs. 17.9%) while the sigmoid septum phenotype was more frequently observed in G- patients (67.9% vs. 7.7%). In both cases these differences were statistically significant. Median maximum wall thickness measured by transthoracic echocardiography was greater in G+ patients compared to G- patients (21 mm, IQR 17.7-22.5 vs. 17 mm, IQR 16-18.8, respectively; p = 0.016). Left atrial diameter was smaller in G+ patients (38.6 ± 5.8 mm vs. 44.5 ± 4.5 mm; p = 0.001). The information of CMR with gadolinium-based contrast agent was obtained in 37 of the 41 patients. LGE was observed in all G+ patients compared to 69.6% of the 28 G- patients (p = 0.027).
With regard to the risk of sudden cardiac death, median ESC HCM Risk-SCD score was higher in G+ patients (2.3, IQR 1.8-4.5 vs. 1.8, IQR 1.4-2.7; p = 0.038). Of the 13 G+ patients, 6 had an ICD implanted or received an ICD during follow-up, compared to 1 patient of the 28 G- patients (p = 0.0001). The results of the comparison between G+ and G- patients are shown in Table 2. Multivariate analysis revealed that the presence of reverse septal curvature was the only independent predictor of positive GT (OR 21.5, 95% CI 2.72-171.28, p = 0.004).
Table 2
Clinical findings and complementary tests according to the presence of positive (G+) or negative (G-) genetic testing
| Variable | G+ | G- | p |
|---|---|---|---|
| (n = 13) | (n = 28) | ||
| Age, years | 45.3 ±16.4 | 57.1 ±11.7 | 0.012 |
| Age at diagnosis, years | 38.4 ±15.3 | 50.8 ±11.7 | 0.007 |
| Male | 12 (92.3) | 21 (75) | 0.056 |
| Family history of HCM/SCD | 8 (61.5) | 6 (21.4) | 0.012 |
| Hypertension | 6 (46.2) | 21 (75) | 0.072 |
| Symptoms | 8 (61.5) | 20 (71.4) | 0.527 |
| Implantable cardioverter defibrillator | 6 (46.2) | 1 (3.6) | 0.001 |
| ECG/Holter | |||
| Negative T waves | 12 (92.3) | 12 (42.9) | 0.003 |
| Signs of LVH | 7 (53.8) | 9 (32.1) | 0.185 |
| NSVT | 8 (61.5) | 2 (10.5) | 0.002 |
| TTE | |||
| Reverse septal curvature | 11 (84.6) | 5 (17.9) | 0.001 |
| Sigmoid septum | 1 (7.7) | 19 (67.9) | 0.001 |
| Maximum septal thickness, mm | 21 (17.7-22.5) | 17 (16-18.8) | 0.016 |
| LVEF, % | 60 (56-66) | 63 (51-65) | 0.958 |
| LA diameter, mm | 38.6 ± 5.84 | 44.5 ± 4.52 | 0.001 |
| Dynamic obstruction | 3 (23.1) | 11 (39.3) | 0.308 |
| ≥ mild mitral regurgitation | 7 (53.8) | 16 (57.1) | 0.467 |
| Systolic anterior motion, mitral valve | 5 (38.5) | 9 (32.1) | 0.750 |
| ≥ mild diastolic dysfunction | 12 (92.3) | 23 (82.1) | 0.504 |
| CMR | |||
| LGE | 13 (100) | 16 (69.9) | 0.027 |
| Maximum septal thickness, mm | 19.6 (17.8-22.8) | 17.4 (14.7-20.1) | 0.049 |
| Apical displacement of papillary muscles | 5 (41.7) | 5 (23.8) | 0.283 |
| HCM Risk-SCD score | 2.3 (1.8-4.5) | 1.8 (1.4-2.7) | 0.038 |
CMR: cardiac magnetic resonance imaging; ECG: electrocardiogram; HCM: hypertrophic cardiomyopathy; LA: left atrial; LVEF: left ventricular ejection fraction; LVH: left ventricular hypertrophy; LGE: late gadolinium enhancement; mm: millimeters; NSVT: non-sustained ventricular tachycardia; SCD: sudden cardiac death; TTE: transthoracic echocardiography
Qualitative variables are presented as frequency and percentage, and quantitative variables as mean ± standard deviation or median and interquartile range.
The most relevant findings of the analysis are summarized in Figure 1.
Fig. 1
Variables associated with positive versus negative genetic testing CMR: cardiac magnetic resonance ; ECG: electrocardiogram; HCM: hypertrophic cardiomyopathy; ICD: implantable cardioverter defibrillator; NSVT: non-sustained ventricular tachycardia; TTE: transthoracic echocardiography;
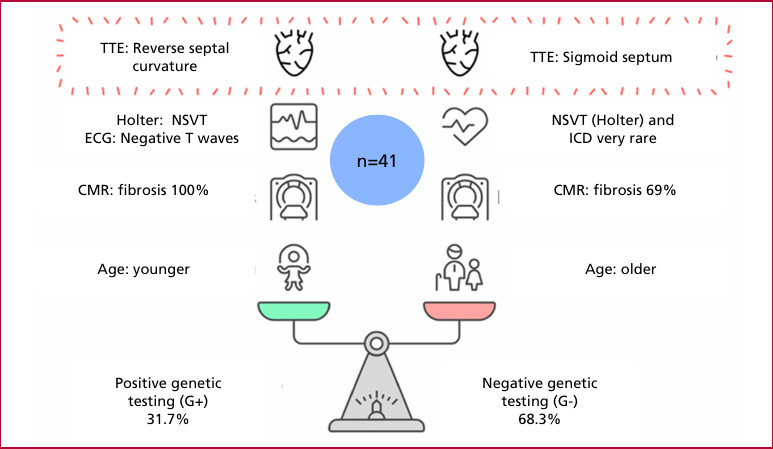
CMR: cardiac magnetic resonance ; ECG: electrocardiogram; HCM: hypertrophic cardiomyopathy; ICD: implantable cardioverter defibrillator; NSVT: non-sustained ventricular tachycardia; TTE: transthoracic echocardiography;
DISCUSSION
Genotype-phenotype correlation
HCM is a disorder with variable phenotypic expression, and the genotype-phenotype correlation is a significant area of ongoing research. In our study, we found that 31.7% of the population undergoing genotyping had a pathogenic (or like pathogenic) variant in sarcomere proteins. The two most common variants were found in the genes that encode the cardiac myosin binding protein C (MYBPC3) and the beta-myosin heavy chain (MYH7), as described in the literature. (1)
The reverse septal curvature pattern had the strongest association with positive GT. Since the initial descriptions of genotype-phenotype correlation, such as those by the Mayo Clinic group, this pattern has been demonstrated to be the strongest predictor of positive GT (79% in G+ patients vs. to 8% in patients with a sigmoid septum). (11) Our results were similar: 68.8% of patients with reverse septal curvature were G+ vs. only 5% of patients with sigmoid septum. In Bayesian analysis, the presence of reverse septal curvature increased the probability of positive GT from a pre-test value of 31.7% to 71%, corresponding to a positive likelihood ratio of 5.17. This finding serves to reinforce the notion that the potential yield of GT in selected patients can be remarkably high.
In the general cohort, the percentage of positive GT was similar to the 38% reported by the Mayo Clinic in an unselected population. The Mayo Clinic score is a prognostic tool used to predict the diagnostic yield of GT. It incorporates various clinical and echocardiographic parameters, including age at diagnosis < 45 years, maximum septal thickness ≥ 20 mm, family history of HCM or sudden cardiac death, and reverse septal curvature on echocardiogram (one point for each factor). The concomitant presence of hypertension is a negative predictor, with a score of -1 point. (12) This score has undergone multiple subsequent validations, exhibiting adequate specificity but variable sensitivity. (13,14) A recent study conducted in Argentina demonstrated a diagnostic yield of 80% in patients with a Mayo Clinic score ≥ 3. (15) As with the score, our study found that G+ patients not only had a higher prevalence of the reverse septal curvature phenotype; they were also younger at the time of diagnosis, had a higher burden of family history, and had greater maximum wall thickness compared to G- patients. However, these variables did not reach significance in the multivariate analysis, possibly due to the small number of patients.
Prognostic implications
G+ patients already had an ICD implanted or it was implanted during outpatient follow-up in 46.2% of cases, compared to only 3.6% of G- patients. The prevalence of NSVT on ECG Holter monitoring was higher in G+ patients, who also presented higher HCM Risk- SCD score, as reported in the literature. (16) Various studies have shown that positive GT represents an increased risk of death, ventricular dysfunction, heart failure, and need for transplantation. (17,18) There is even evidence of higher-risk variants such as mutations in MYH7, mainly in highly conserved regions such as the converter region. (19) However, after adjustment for other factors, the association between sarcomeric variants and sudden cardiac death loses significance. (20) Therefore, the guidelines do not yet consider the genotype an indication for ICD placement. (1,21)
Finally, the presence of fibrosis on CMR in our study was more prevalent in the G+ group. However, despite fibrosis is clearly associated with a worse prognosis, some degree of LGE is a common finding in HCM, (22) so this finding cannot be considered to identify patients at higher risk.
Clinical perspectives and real-world applicability
According to the 2023 and 2024 guidelines for the management of cardiomyopathies, GT in patients with HCM is a class I recommendation with a level of evidence B to confirm the diagnosis, assess prognosis, stratify treatment, and provide reproductive counseling. (1,21) Nevertheless, in Argentina access to GT is limited, (23) and patients often have to cover the cost of the test themselves. In this context, phenotypic predictors that increase pretest probability of a positive GT result may provide justification for funders or insurers, with a direct impact on improving access.
Our study validates that some phenotypic patterns (such as reverse septal curvature) can significantly increase the yield of GT. Moreover, the present study was conducted in a center that does not specialize in familial heart diseases. This fact underscores the clinical applicability of the study in real-world settings, where the majority of patients are typically seen in general centers.
STUDY LIMITATIONS
The most relevant limitation of our study is that, although GT was indicated in all patients to avoid selection bias and that it represents a general cohort, the results could only be obtained in just 55% of cases, primarily due to the high cost of the test and the lack of coverage by the health system. A recently published multicenter registry from Argentina that included data from eight provinces reported an even lower percentage of GT performed (23), which highlights the real difficulty access nationwide. In most cases, the NGS panel performed was basic and included only core genes and main phenocopies. Although this practice is supported by the literature, the yield of GT could have been improved if an expanded gene panel had been analyzed. (1) Both limitations reflect the high cost of this tool and its difficult access. It is clear that the introduction of precision medicine and a genetics-based approach confer benefits for patients, but it is also true that we constantly face limitations due to the socioeconomic situation and restrictions imposed by the different health coverages. Finally, it should be noted that, although multivariate analysis showed a statistically significant association between reverse septal curvature pattern and positive GT, the extremely wide confidence interval reflects a high level of uncertainty in the estimation, clearly related to the sample size. For this reason, we decided not to report this finding as a conclusive associated factor, and its result should be interpreted with caution.
CONCLUSIONS
In a cohort of patients diagnosed with HCM, one-third of those who underwent GT exhibited sarcomere protein mutations. The presence of a reverse septal curvature seems to be the variable most strongly associated with a positive GT. Given the limitations in our setting for accessing the test in patients with cardiomyopathies, knowing the variables that could be associated with a greater diagnostic yield may help refine the selection of patients who are candidates for this tool.
Conflicts of interest
None declared.
(See authors' conflict of interests forms on the web).